Field campaigns are a fundamental element to many precision agriculture studies. Indeed, sampling is necesary to calibrate a agronomic model or to evaluate the spatial structure of valuable and non accessible (or at least with difficulty) information via remote or proxy sensing (soil water status, leaf nitrogen content…) [Fig. 1]. The location in space of the future samples must be evaluated with care because field campaigns are often expensive and time-consuming. Besides, one has to be sure that the samples will enable to embrace all the spatial structure within the field. There is a trade-off between over sampling (expensive and cumbersome) and under sampling (relatively cheap but the fields are not well characterized). As the name suggests, smart sampling is the strategy that aims at carefully locating the samples in space to optimize this trade-off. Several sampling approaches exist and some of them will be detailed below.
Random sampling
Random sampling cannot be included in the smart sampling techniques. This is the most simple sampling scheme that one can imagine. Samples are placed within the field completely randomly. Intuitively, there is a strong probability that all the information in the field is not captured. It is acknowledged that this sampling method is not really efficient.
Regular or grid-based sampling
Regular sampling is a simple smart sampling approach. This method considers that a reliable way to capture the spatial structure within the field is to locate the samples on a regular grid so that the whole field is covered with samples. In a way, this approach is not that “smart”, it was thought to be a relatively exhaustive sampling technique. This method has the advantage of being relatively easy to put into place but it does not take into account any information regarding the field. This regular sampling could miss some site-specific phenomenom or, on the contrary provide repetitive information at the expense of some time and money.
Irregular sampling
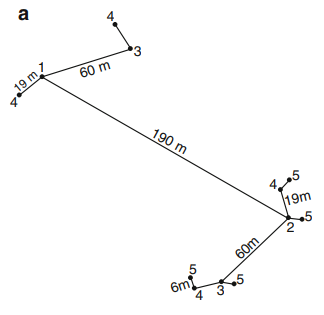
Regular sampling is interesting to consider in the sense that it is relatively simple to set up and that the entire plot is generally covered. Nevertheless, when trying to accurately assess the spatial structure of an agronomic property of interest, this type of sampling scheme appears to be somewhat limited. With regular sampling, relatively little importance is given to the correlation between observations separated by short distances (because it is preferable to sample everywhere in the plot, even if it means sampling less at each location of the plot). This aspect is problematic for the construction of the experimental variogram because the nugget effect is often poorly estimated and therefore the model fitted to the experimental variogram is not optimal. In these specific cases, irregular sampling is recommended because it is done to optimize the evaluation of the spatial structure at several scales. An example is provided in Figure 1 but many other sampling schemes are possible

Figure 1. Example of an irregular sampling scheme
Stratified sampling (use of auxiliary information)
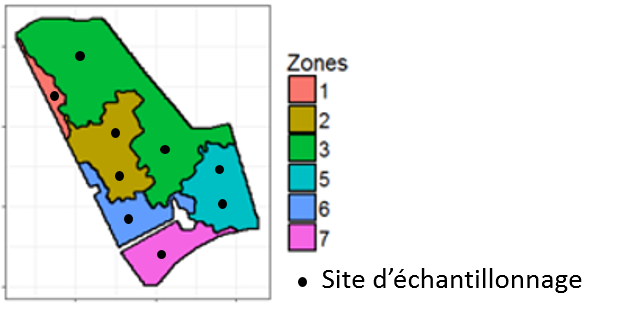
When auxiliary information (generally with a high spatial resolution) is available to help the sampling scheme, one talks about stratified sampling (Fig. 2).
For instance, before performing complex soil analyses, it could be interesting to locate the samples based on a soil apparent electrical conductivity or a vigour map.
n this case, the auxiliary information can be classified in quantiles or following the outputs of the k-means algorithms (or other classification-based methods). The auxiliary information might be delineated into management zones and the samples might be placed within each zone with the number of samples depending on the size or the variability of each zone. It has to be noted that this useful auxiliary could be univariate or multivariate. Indeed, the classification or management zones delineation might involve more than one variable.

Figure 2. Example of zone-driven sampling
Sampling with a semi-variogram
As it was previously stated in a former post, the semi-variogram might be used to help find the sampling spatial distance between observations. For that purpose, auxiliary data need to be available as in the stratified sampling technique. The rule of thumb that is recommended is to set the distance between samples as half the range of the auxiliary variable.
Sampling based on a historical database
The last method to be discussed relates to the use of a historical database. The objective is to benefit from the collection of samples over multiple years on specific sites to select the sites that will be the more profitable to explain a variable of interest. The variable of interest shoud be relatively hard and expensive to obtain.
For instance, assume that you want to monitor the plant water status within a field but you do not know where to locate your samples. One possibility would be to first perform a regular sampling analysis over a couple of years with a Scholander pressure bomb (let us say three to five years). Then, a correlation model could be implemented to derive the plant water status of all the locations based only on a subset of observations. Imagine that 40 sites were considered at first. The model might be able to compute the plant water status at these 40 locations by only using the plant water status of 6 locations. In this case, these 6 locations could be used for the following years as smart sampling positions to explain correctly the plant water status within the field
Obviously, this method requires a considerable amount of time at the beginning of the analysis to calibrate the model. However, once it is established, the monitoring of the variable is much easier and more efficient.
Support Aspexit’s blog posts on TIPEEE
A small donation to continue to offer quality content and to always share and popularize knowledge =) ?

