Parameter setting of QGIS and R
The presentation of QGIS is no longer necessary! This open-source platform is now widely used in many domains to visualize, exploit and process spatialized data. The processing functions inherent in QGIS in addition to all those of the associated geographic information systems (SAGA, GRASS…) via the geoprocessing module allow users to have at their disposal a wide range of algorithms to effectively enhance their data. However, when no functions meet their needs (and no new ones are available in the proposed extensions), users must start programming them on their own… Ow! It is then possible for them to write their own functions in the QGIS Python console. If like me, you prefer to work under the R language, it is also possible to make a link between R and QGIS so that you can use your R algorithms directly under QGIS and integrate them, why not, into a processing chain (via the graphical modeler) that you would have previously built in QGIS. In this post, I will show you the settings to make so that QGIS can discuss with R, and I will present a simple example of processing (an interpolation of high resolution within-field yield data by an inverse distance weighting algorithm) programmed in R and launched via QGIS after loading wheat yield data from a French field there. Let’s go!
These operations are not very complicated (and they should work, we cross our fingers) but require having R already installed on your machine! From QGIS 3 onwards, you will need to install the “Processing R Provider” extension that you will find in the “Extension” menu ==> “Install/Manage extensions…” to be able to use R in QGIS. Once you have installed the extension, you can open the Processing Toolbox (in the Processing tab ==> 1.) if it is not already open on the right of your screen.
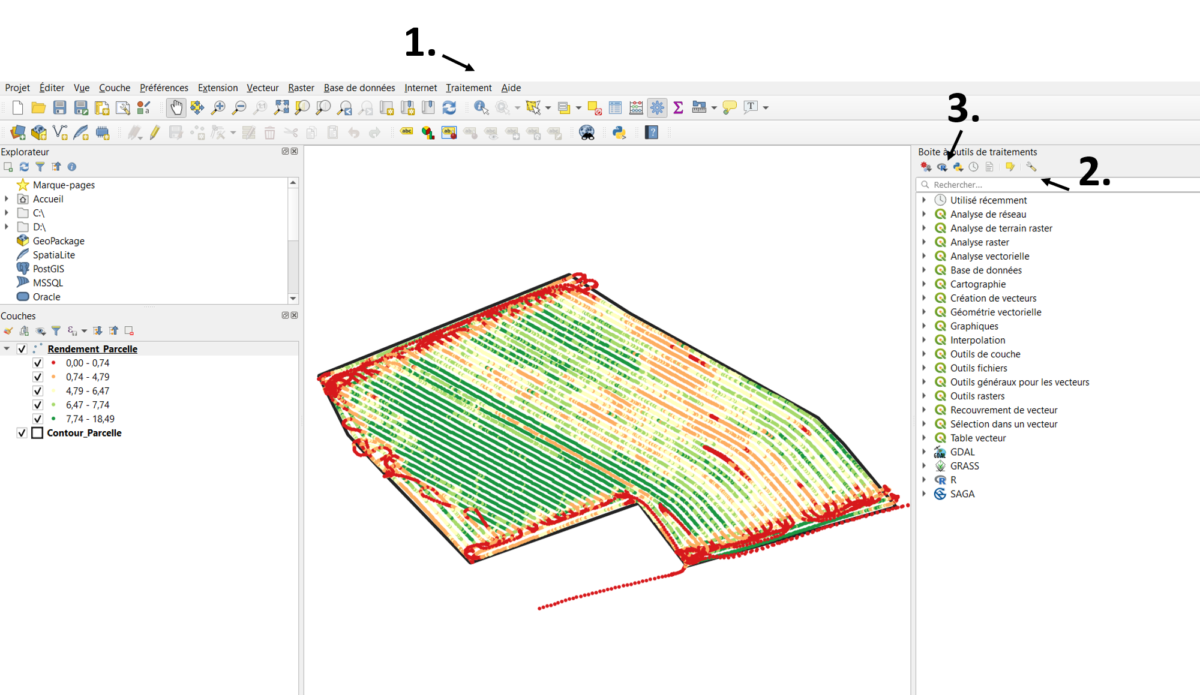
Figure 1. Opening the processing toolbox
You can then configure the links between R and QGIS by clicking on the “tool” icon in the processing toolbox (==> point 2. in Figure 1). This will bring up the following window (see Figure 2). The important paths to set up are the “R folder” which will tell QGIS where R is installed on your machine, and the “User library folder” which is the folder where the R libraries are installed when you install new ones. There is generally no need to change the “R scripts folder” which is the directory where the R scripts that you will save via QGIS will be stored. Remember to validate the “Use 64 bit version” if you have installed the 64 bit version of R. You can then validate these settings by clicking on “OK” at the bottom of the window.
NB: You may get an error message when validating your toolbox, which is often not related to the R settings but to GRASS ones. You can get a message telling you that a certain path in the GRASS tool settings does not exist (often because a directory in this folder -‘msys’ – does not exist). You can find this path by scrolling through the GRASS settings just above R in Figure 2. One solution to solve the problem is to point the failed path to an existing directory or to simply create an empty “msys” directory where the path points.
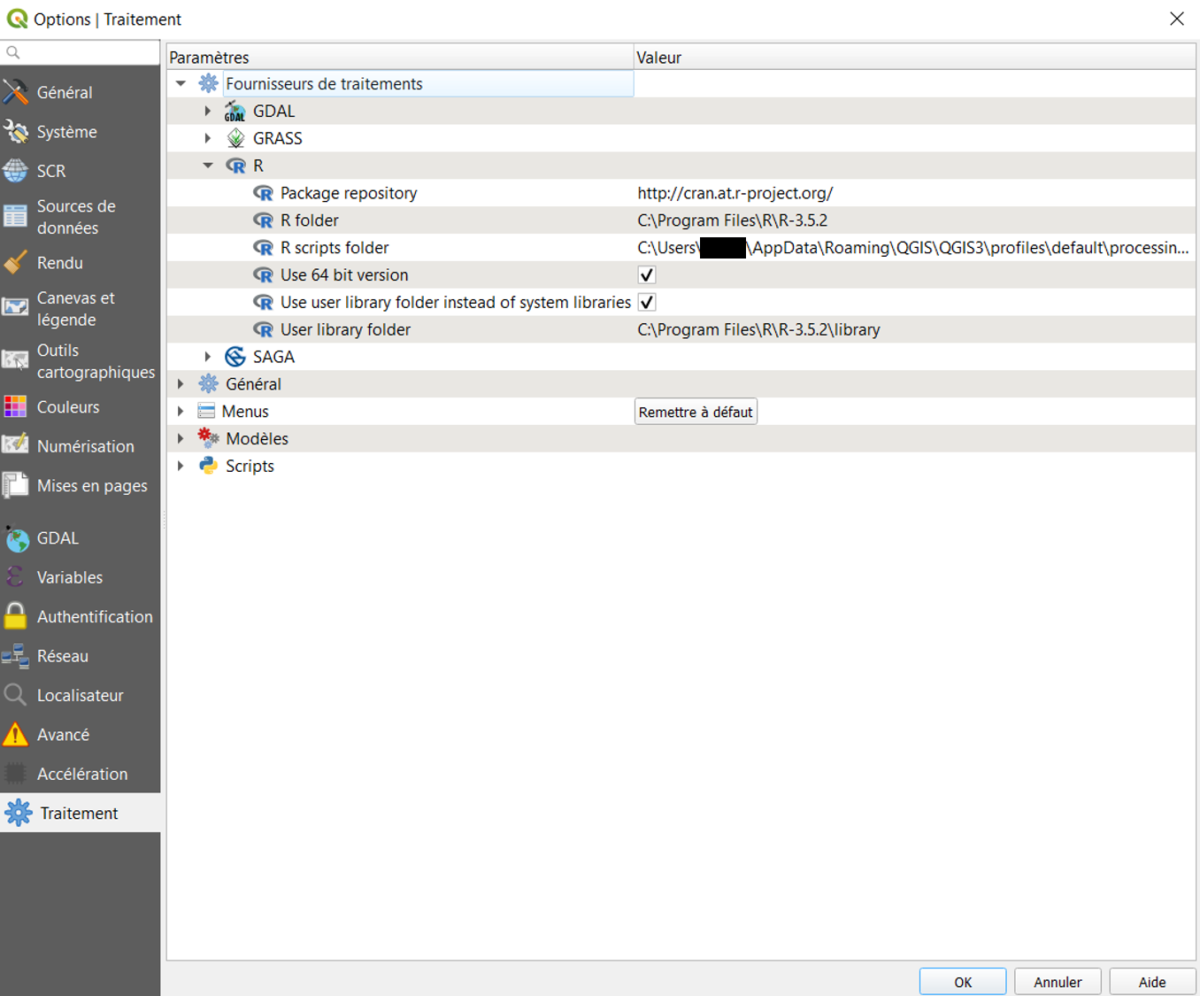
Figure 2. Setting up R in QGIS
After these manipulations, if all goes well, it should work! You can also find relevant information in this video
The treatment to be carried out
As mentioned in the introductory section, we want to interpolate by inverse distance weighting the wheat yield data over the available field. I will not go into the details and parameterization of this process but it must simply be understood that we will estimate the yield at all positions (in all meshes of a grid more precisely) where we do not have yield information. There are two input layers: the plot contour (polygon in vector format) and yield point data (also in vector format).
Some rules of good conduct
When you want to write an R code in QGIS, there are nevertheless a few specific code lines to specify at the beginning of the code. These are lines that start with hashtag # so that QGIS can understand the R code (see below). A very important remark: in R, we often put comments with hashtag, you have to remove them here otherwise QGIS will not understand the code! It will think that these are input parameters… One of the rather annoying problems despite everything is that if there is an error in your R code, you will not know where it comes from… hence it is important that you make sure beforehand that your code works in R already, and therefore that the only possible error comes from your R-QGIS setting or the few lines you have entered at the beginning….
Implementation of the R code in QGIS
You can create a new R script by clicking on the R tab of the processing toolbox (point 3. in Figure 1.). You can then copy and paste your code into the proposed script editor (Figure 3.)
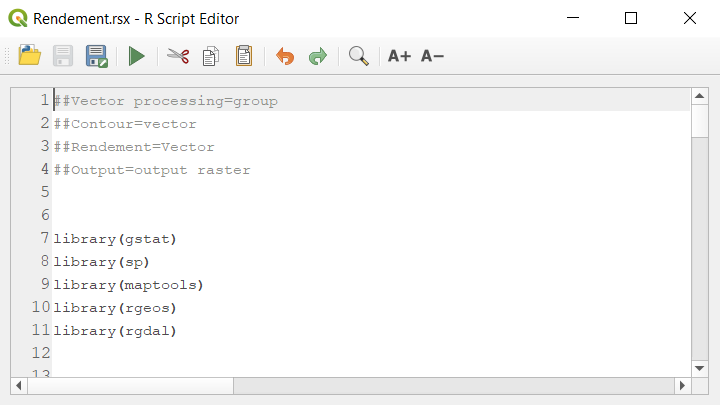
Figure 3. R script dans QGIS
In the introductory part of the code, we find the following four lines!
##Vector processing=group
##Contour=vector
##Rendement=Vector
##Output=output raster
1st line ⇒ In QGIS, in the “scripts R” group of the geoprocessing module, our script R will be found in a group called “Vector processing”. This first line is essentially used to classify its scripts
2nd line ⇒ It is the contour of the plot that is called “Contour” in the R code. We inform that this layer is a vector with “=vector”
3rd line ⇒ These are the yield data that are called “Yield” in the R code. We inform that this layer is a vector with “=vector”
4th line ⇒ The output layer of the algorithm is called “Output” in our code. This layer is a raster because we are going to create a raster of interpolated yield. This is explained with the command “=output raster”.
It’s the only thing that needs to be changed on the code to make it work! (I remind you to remove comments with #’s from your code). You can also find other commands on the QGIS documentation online if you need other types of data to use in QGIS. Once the code has been registered (I have given the name “Rendement”), you will see that it appears in the “Vector processing” group! (Figure 4). If it does not appear, close and restart QGIS, there are sometimes update problems.
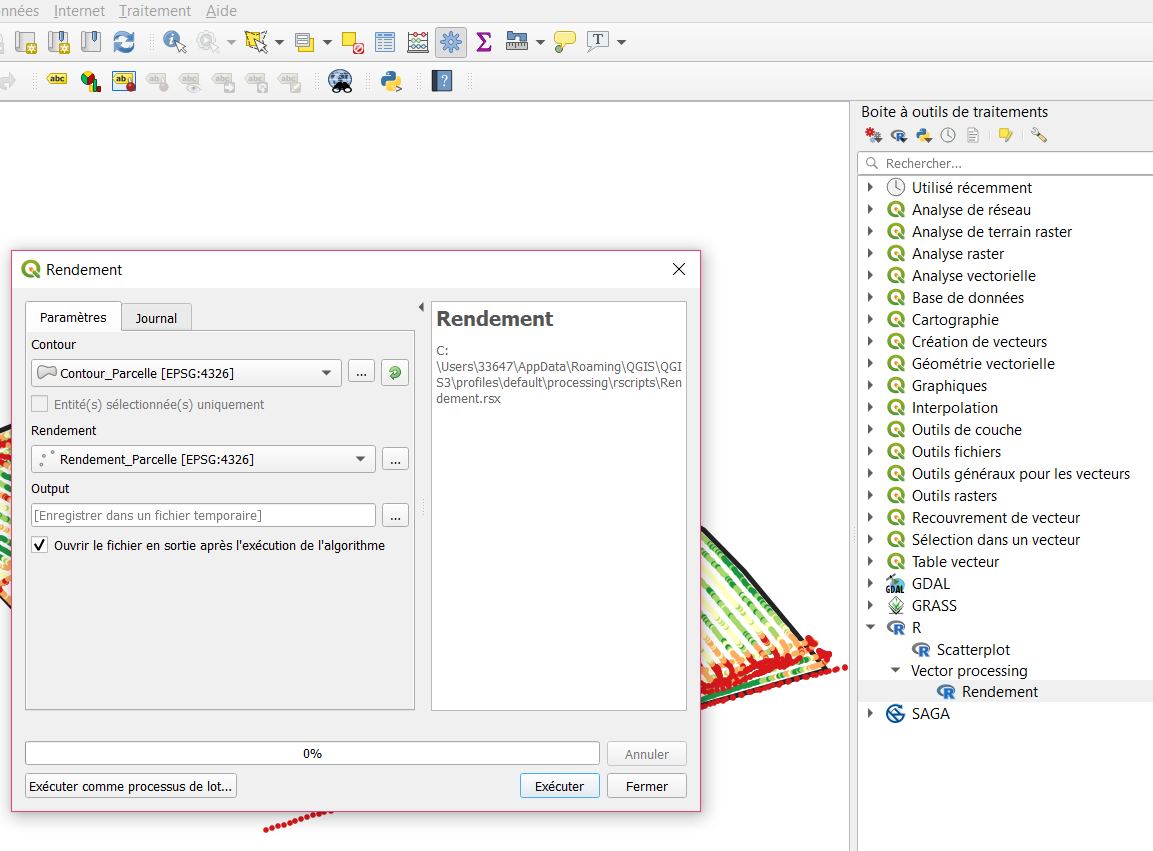
Figure 4. Launching the R script in QGIS
By double-clicking on the “Rendement” function that has just been created in the processing toolbox, you launch the script with the input parameters (“Contour” and “Rendement”) that you have entered in the R code. On the other hand, the “Contour” and “Rendement” variables must be used in the code, of course… All you have to do is load the corresponding layers into QGIS (beforehand) and fill them in this window.
Launching the script
And here are the within-field yield data interpolated (Figure 5.) ! I can now even call this R code directly from the graphical modeler to add it to a processing chain.
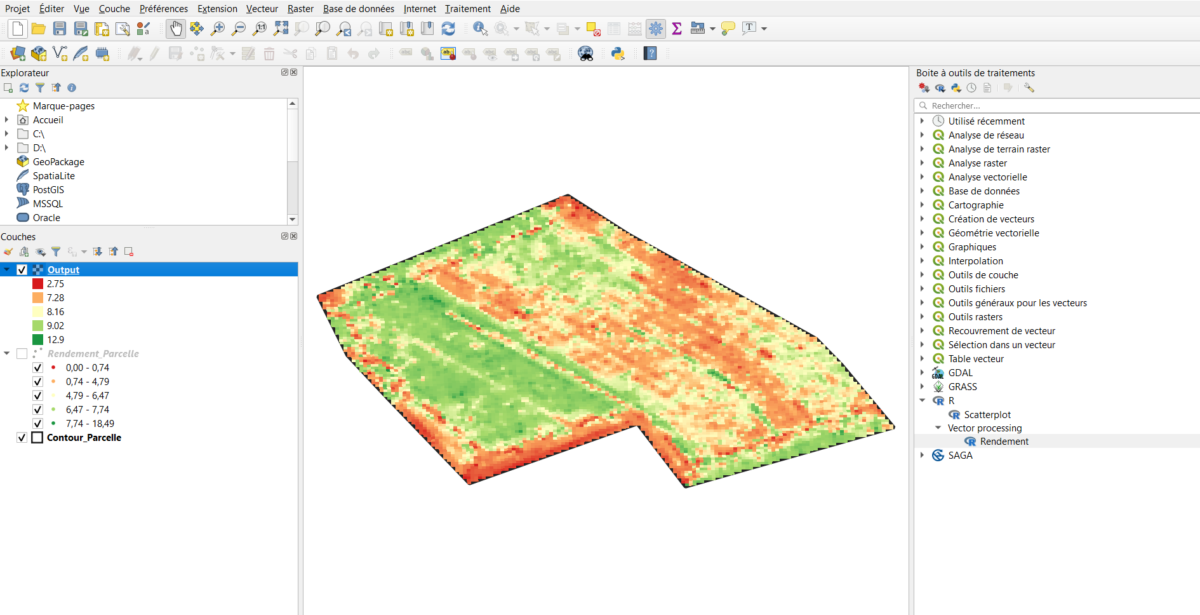
Figure 5. Result of interpolating performance data in QGIS using an R code.
Making the link between R and QGIS is especially interesting if you need to share specific applications/processes with people who do not master this programming language or who lack skills in spatial data analysis. Of course, if it is just for your own use, there is less interest (except that it is easier to visualize the spatial data generated in QGIS). The processing proposed here is very simple and is not intended to be reused directly as it is, the objective was exclusively to show how to run an R code in QGIS.
Support Aspexit’s blog posts on TIPEEE
A small donation to continue to offer quality content and to always share and popularize knowledge =) ?

