The International Society for Precision Agriculture (ISPA), proposed a definition of Precision Agriculture in 2019 following exchanges between 45 scientists from around the world: “Precision Agriculture is a management strategy that collects, processes and analyzes spatial, temporal and individual data, and combines them with other information to guide adaptive management decisions related to the plant or animal in order to improve resource efficiency, productivity, quality, profitability, and sustainability of agricultural production. Precision Agriculture, and if we are looking to expand the spectrum around digital in agriculture in general, is a sector often presented by agricultural professionals as one of the solutions to make the agricultural sector more technically and economically efficient, while limiting environmental pressures. And these pressures are multiple: water, air and soil quality; biodiversity; deforestation; energy resources; global warming… But is enough attention being paid to the impact that digital technology itself imposes on the environment? Are the gains brought by digital technology significant – and positive – compared to what digital technology costs the environment? In this work, I will focus exclusively on greenhouse gases in the agricultural sector, particularly because the subject of global warming is particularly burning at the moment – you will agree – and digital is now regularly presented as a spearhead in the fight against global warming. It is very clear that agriculture is a complex activity, at the interface of many fields, and that it cannot be summed up or understood simply in terms of greenhouse gases. Nevertheless, the case study is interesting and at the heart of current concerns. I will begin with some fairly general reminders on climate change, before moving on to observations and discussions on the carbon footprint of the agriculture sector, digital sector and on the combination of both digital and agriculture. I will try to raise observations and questions that I hope will be listened to carefully. A bibliography and webography are available at the end of the document for interested readers.
Global warming in a few words
Global climate change
Global warming is a reality. Despite the few climatosceptics who have not yet taken the plunge, a very broad consensus (a priori more than 97% of experts on the subject) has emerged from the scientific community on global warming and its anthropogenic origin. The first alerts did not come out yesterday. At the time, the OECD was concerned about a potential emerging global crisis and the planet’s limits to growth. In the late 1960s, the OECD set up a body consisting of a panel of experts, the Club of Rome, to address the issue. A few years later, in 1972, the “Meadows Report” – named after MIT researchers Dennis and Donella Meadows – with the evocative title “The Limits to Growth” was published, which drew a rather gloomy picture of the climate trajectory that the world was taking. Using mathematical models that describe the world in a fairly simplified way in the form of feedback flows and loops (births, deaths, pollution, production of goods, etc.), Meadows and his research team have been forecasting, since the early 1990s, the terrible impact of the irrational exploitation of the planet’s finite resources. I suggest you read their report, “Limits to Growth: 30-year update”, which only confirms their emerging concerns a few decades earlier. This report is still relevant today…
Global warming leaves no room for doubt when looking at temperature histories over fairly recent periods of time (Figure 1), and its anthropogenic origin is clearly evident when these histories are studied over longer periods of time (Figure 2A).
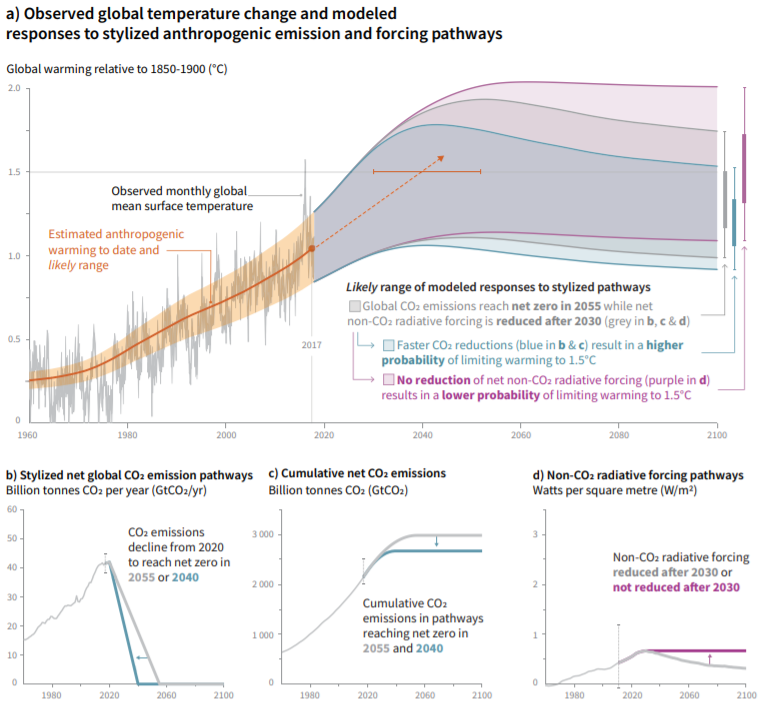
Figure 1: Evolution of temperatures and CO2 emissions from 1960 to the present day, modelled to 2100. Source: IPCC Report 2019.
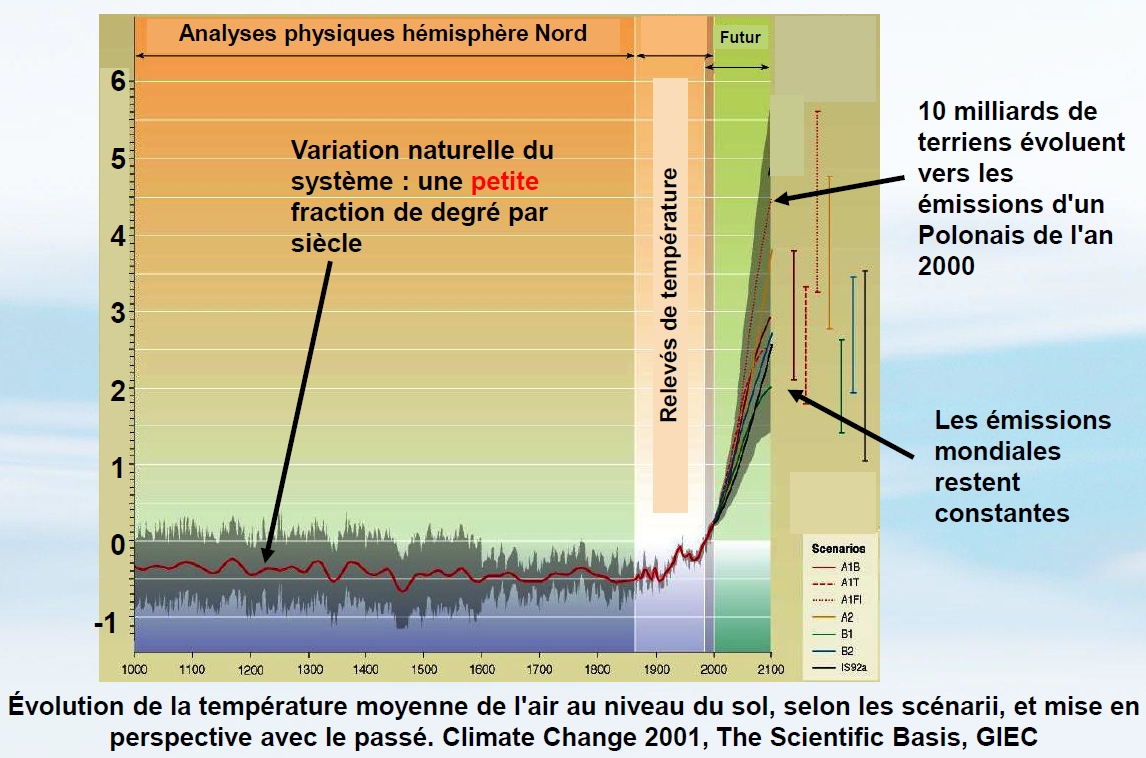
Figure 2A. Evolution of the average air temperature at ground level under different warming scenarios. Source: IPCC, 2001. Image taken from Jean Marc Jancovici’s cours des mines. Records show strong temperature increases from the industrial revolution onwards. Over this relatively short period of time (from the Industrial Revolution to now), the increase is disproportionately large compared to the temperature variations of the last millennium.
Over very long periods of time (Figure 2B), it can be seen that the average global temperature has tended to cool down (note that in this graph, old times are on the right and recent times on the left). Several million years ago it was indeed much warmer than it is now. Nevertheless, two things should be kept in mind. The first is that we are experiencing global warming over an extremely short period of time (150 years) compared to the temperature variations of the last few million years. Secondly, the conditions in which we are living today are very different from those of several tens of millions of years ago: there are soon to be 8 billion people on earth. The human species will most certainly survive this warming, but at what price?
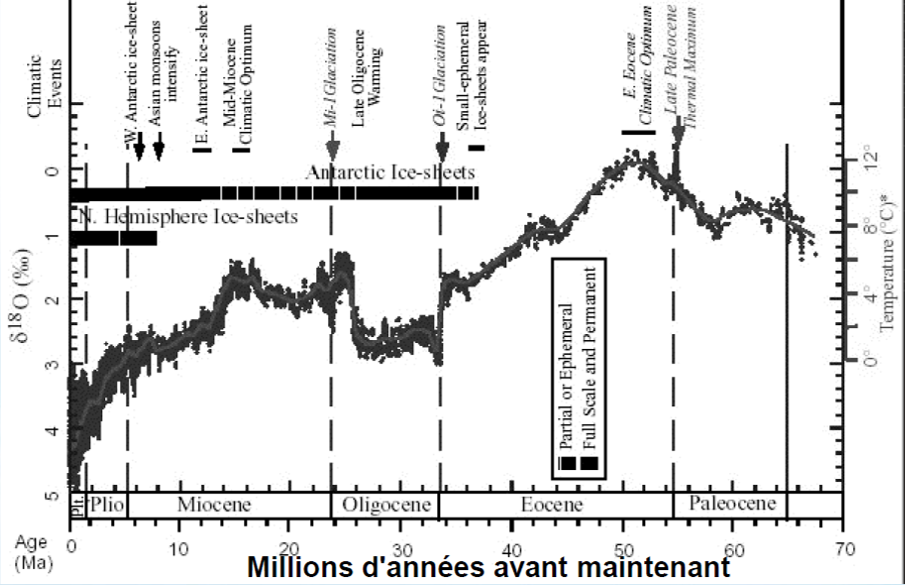
Figure 2B. Estimated global average temperature, relative to the average of the last millennium (y-axis zero). This curve was obtained by analyzing ocean sediments collected from 40 different locations. Source: Zachos et al (2001). This graph shows that the temperature has decreased significantly over the last 70 million years (the graph can be read from right to left) but that it is now rising again (the big pie on the far left of the figure), and this in a very, very short period of time, contrary to the changes in the climate.
A few degrees warmer, what difference does it make?
The trajectories modelled by the experts of the IPCC – Intergovernmental Panel on Climate Change – and other research groups are quite frightening, with temperature changes ranging from +1.5° to +5°C or even +6°C compared to the temperature of the pre-industrial period (considered as the reference temperature). To tell the truth, when you think about it at first, a temperature increase of 5 to 6°C doesn’t seem so terrible; it’s well below the temperature variations that we can feel at our level every day. Nevertheless, when you think about it on an individual scale, this temperature increase is very local (it only concerns us). An increase of 5 to 6°C in the average temperature on a global scale is quite different! Five degrees less global average is what separates our current climate from that of 20,000 years ago (Figure 3). Slightly different, you’ll agree…
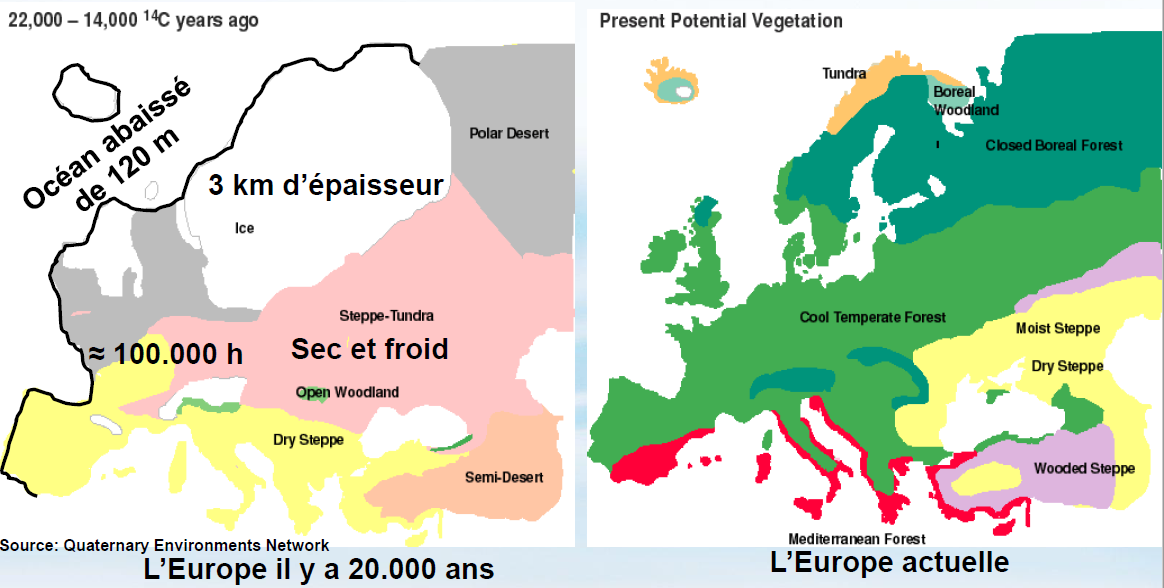
Figure 3: Comparison of today’s environment with that of 20,000 years ago, when the average global temperature was five degrees lower than today.
The impacts of a warming climate are extremely varied, and will be all the more important the more severe the warming. Flooding, loss of agricultural yields, loss of biodiversity… these are the multiple risks involved. The IPCC has in fact worked on the impacts and risks for a number of natural, managed and human systems (Figure 4). The graphs speak for themselves.
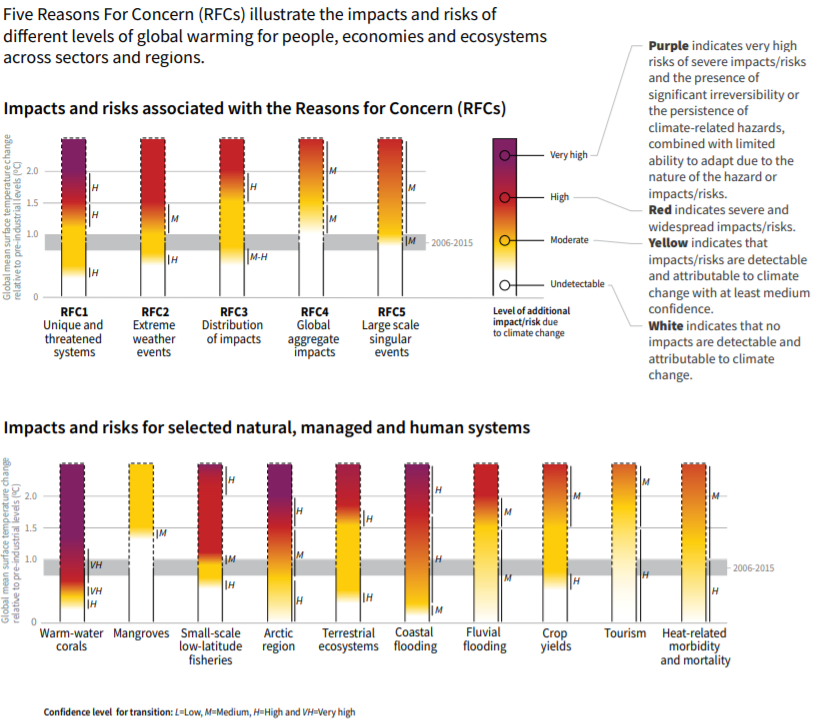
Figure 4: Impacts, Impacts, and Risks Associated with Global Warming. The severity of these impacts depends on the strength of the warming. Source: IPCC Report, 2019.
And the signs of global warming are widely visible. The latest report by IPBES 2019 – the Intergovernmental Science-Policy Platform on Biodiversity and Ecosystem Services – has highlighted the critical decline in biodiversity. The Arab Spring crises of 2011 can be largely explained by the droughts that led to a sharp decline in yields in the major Russian production areas. Raw material prices then exploded and countries that were not self-sufficient and did not have sufficient financial resources (e.g. from oil) to cope with these price increases paid a high price!
Growth and CO2
To show their interest in this subject of general interest, the world’s governments have decided, since the Rio Earth Summit in 1992, to meet every year at the COP (Conference of Parties) to plan together a response and actions to be taken to limit the observed global warming as much as possible. The most well-known conferences or those whose names are still remembered (whether for their failures or successes) – Kyoto, Copenhagen, Paris – were widely followed by the population and relayed by the media. It is clear that the conferences did not really lead to the expected results (Figure 5). CO2 concentrations in the atmosphere are not decreasing at all!
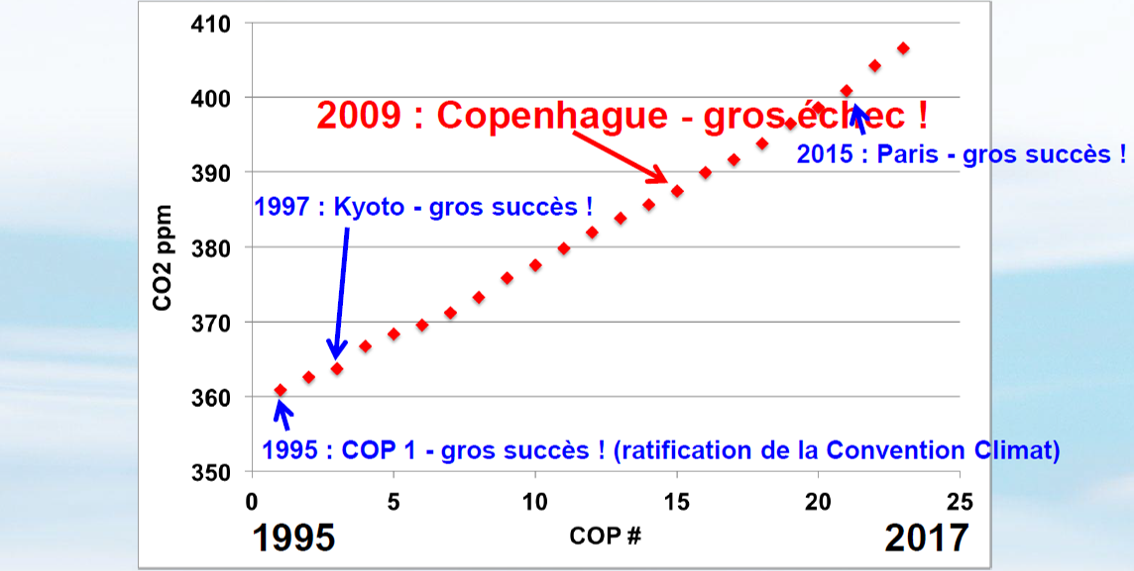
Figure 5: Atmospheric CO2 concentration measured at each Conference of the Parties. Source: Jean-Marc Jancovici’s Cours des mines, based on NOAA ESRL data. “Gros échec” stands for “Big Failure”. “Gros succès” stands for “Big Success”.
Governments do not seem to have considered the magnitude of the problem. The reason for this is quite simple: governments think and believe in only one thing, the growth of their economies. And despite the promises and calls for decarbonized growth that they believe would combine both the sacrosanct growth and reduction of greenhouse gases, the reality is terrible; we cannot decouple global GDP from atmospheric CO2 (Figure 6). The relationship between these two parameters is absolutely linear. This relationship obviously varies between countries, but taking a step back on a global scale allows us to identify the main trends.
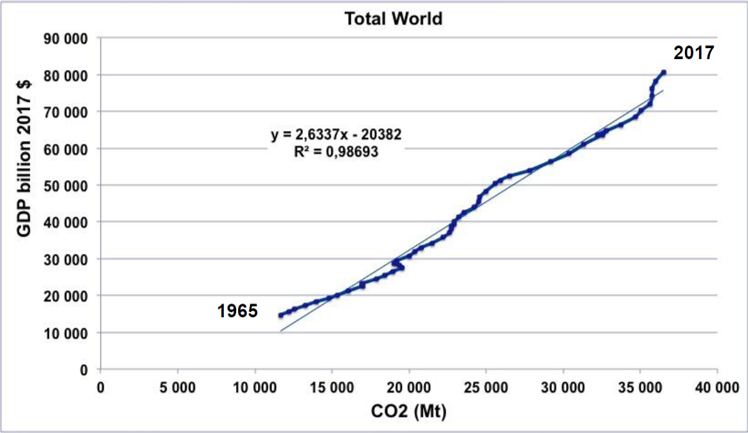
Figure 6. CO2 emissions (x-axis) and GDP in constant dollars (y-axis) for the world. Source: Mining prices by Jean-Marc Jancovici, based on primary data from the World Bank for GDP and BP Statistical Review for energy.
And all this is not about to stop when governments with proven climate scepticism decide to get out of the Paris agreements put in place at COP-21, one of the very recent conferences where almost all countries agreed on the climate emergency. The Paris agreements decided to limit global warming to +2°C in 2100 compared to the pre-industrial period 1850-1900 used as a reference (in 2020, the average temperature on a global scale is more than 1°C higher than in the pre-industrial period). I refer you to Figure 4 to visualize the impacts and risks of a warming limited to only +2°C (we are currently taking a much more pessimistic trajectory). On a global scale, this objective necessarily requires from today onwards a drastic reduction in anthropogenic CO2 emissions, in particular so that by 2050 they reach about 1/3 of our current emissions. With an average annual carbon footprint of 12t CO2 eq., the French are called upon to reduce their current emissions by a factor of 6 in order to comply with the commitments made in the Paris Agreements.
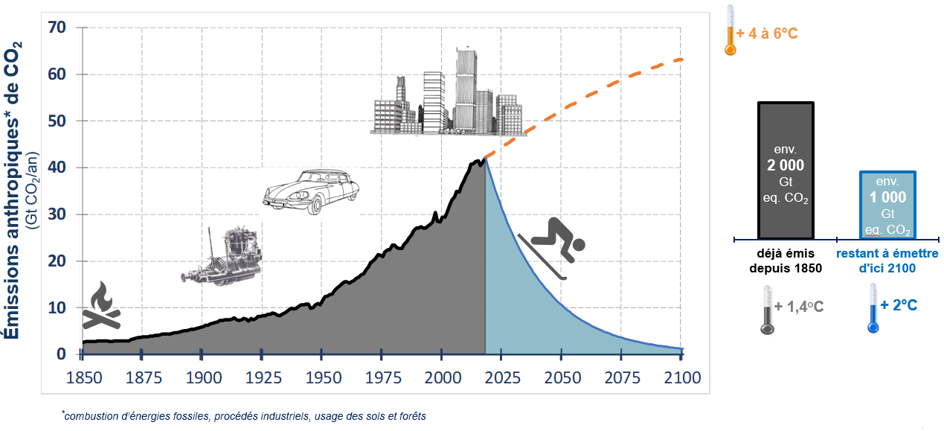
Figure 7. Evolution of anthropogenic CO2 emissions from 1850 to the present day, and the trajectories they would need to take to meet the targets set in the Paris agreements in 2015. Source: The Shifters. The term CO2 equivalent (CO2 eq.) is used here because global warming is due to the emission of greenhouse gases, including but not limited to CO2; for example methane CH4, nitrous oxide N2O or halocarbons (CFC type), whose warming powers are much greater than those of CO2. The term “CO2 equivalent” is used to have a common reference between these different greenhouse gases. We will talk about it again in the rest of this post.
In France, independent bodies were set up following the Paris agreements to assess the paths taken by France to fight global warming. This is notably the case of the High Council for Climate, chaired by climatologist Corinne Le Quéré. The national low-carbon strategy (SNBC) set up by the government has a macroeconomic framework of continuous growth over the next 30 years. It would also be desirable, particularly in view of the likely evolution of the European economy in 2020, to specify how this growth hypothesis is conditional on reaching these objectives…
It’s all about energy
As humans, we have contributed to the very large increase in greenhouse gases in the atmosphere because we consume energy. We find this energy through tools and machines that increase the energy of our bodies tenfold or even a hundredfold. Some would even say that we have around us many “energy slaves”, since we are no longer the ones who supply this energy. For example, with a car, we can travel very long distances. With a tractor, a farmer can use very heavy implements. There are many sources of energy: oil, gas, coal, wood, hydroelectricity, nuclear energy, biomass, solar energy, wind turbines. And this energy consumption, over time, has only increased (Figure 8). Each time a new source of energy was discovered, it did not replace an existing source, but rather added to the energy sources already in use. This is currently the problem with photovoltaic and wind energy that cannot be driven (when there is no wind, there is no energy), which, in addition to their significant carbon footprint, are not used to replace energy sources that emit large amounts of greenhouse gases. Some sources are largely superior to others! Coal, oil and gas – known as fossil fuels – together account for more than 80% of the world’s energy use.
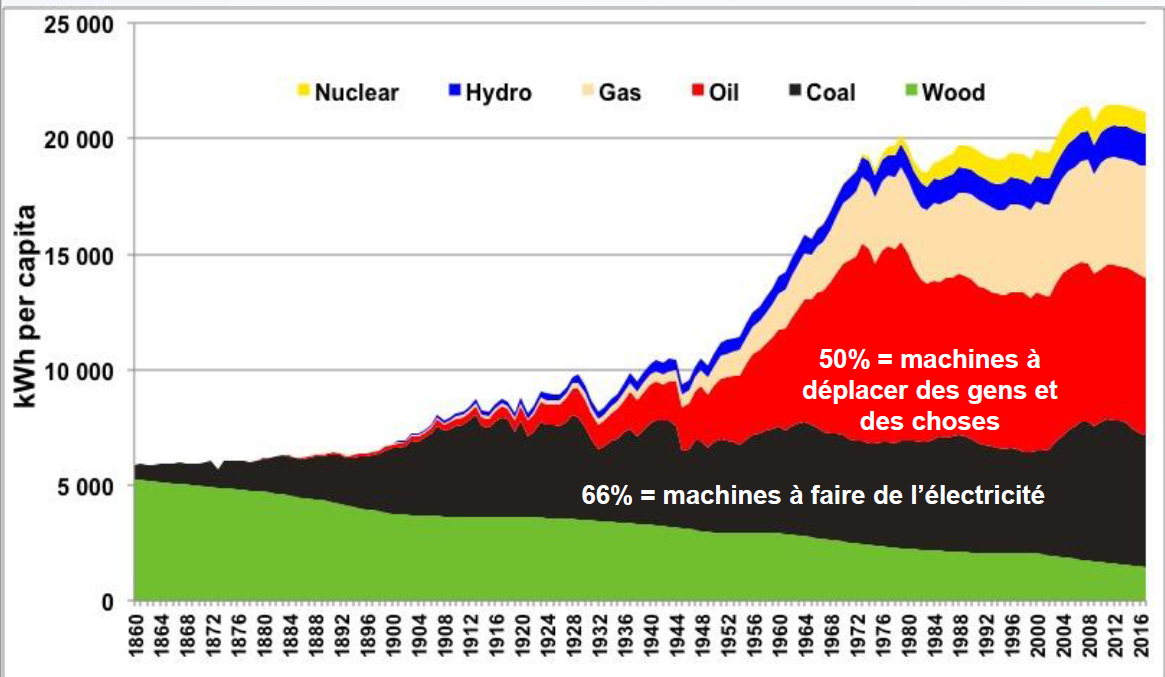
Figure 8. Evolution of energy consumption over time, by type of energy used. Source: Cours des mines by Jean Marc Jancovici.
Each energy source has a more or less significant impact on greenhouse gas emissions. The highest emissions come mainly from oil, coal and gas. In view of these differences, our individual and collective practices must therefore be reasoned according to the type of energy used to achieve them. For example, heating with an oil-fired boiler or a heat pump does not have the same impact on greenhouse gas emissions. As discussed above, the Paris agreements have given each country the opportunity to commit to actions to be taken to combat global warming. Each country, according to its current and future energy mix (all and the proportion of the different energies used in that country) has therefore imagined the trajectories and measures to be taken to achieve the objectives set. However, it must be borne in mind that very often a country’s carbon balance is not simply a question of emissions on its territory. We live in an interconnected world, with increasing global trade. When we buy a smartphone on French territory, for example, it would be completely absurd to consider only the emissions on French territory in view of all the steps that led to its manufacture and delivery on French soil (Figure 9). And for this example of the smartphone, this is without counting on child labor and wars over cobalt or coltan [for smartphone batteries and capacitors] in the Democratic Republic of Congo or the massive use of water in Latin America for the production of lithium [for smartphone batteries]. We should therefore speak of a “carbon footprint” rather than a carbon balance, the first notion taking into account all emissions. And these emissions outside the national territory are not at all negligible! In France, for example, the carbon footprint is nearly twice as large as the national carbon footprint alone.
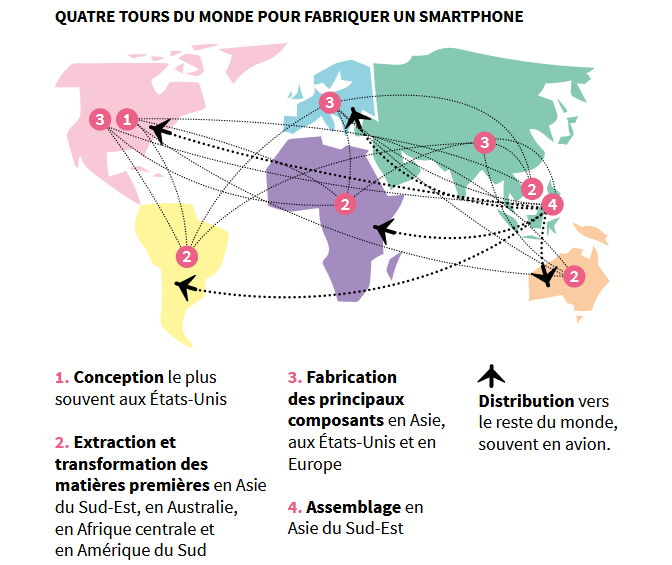
Figure 9. Carbon footprint of a smartphone. Source: M ta Earth
The climate emergency is so close and yet still so far away in the minds of the majority of the population. Global warming calls for a profound paradigm shift from short-term to long-term thinking. The results of the actions that will be taken to limit global warming will only be visible in twenty or even thirty years’ time, and this is perhaps the most difficult to grasp. The molecules of the various greenhouse gases can remain in the atmosphere for a particularly long time (Figure 10). For example, it will take a century for a CO2 molecule emitted 100 years earlier to begin to disappear, and almost a thousand years for it to disappear completely.
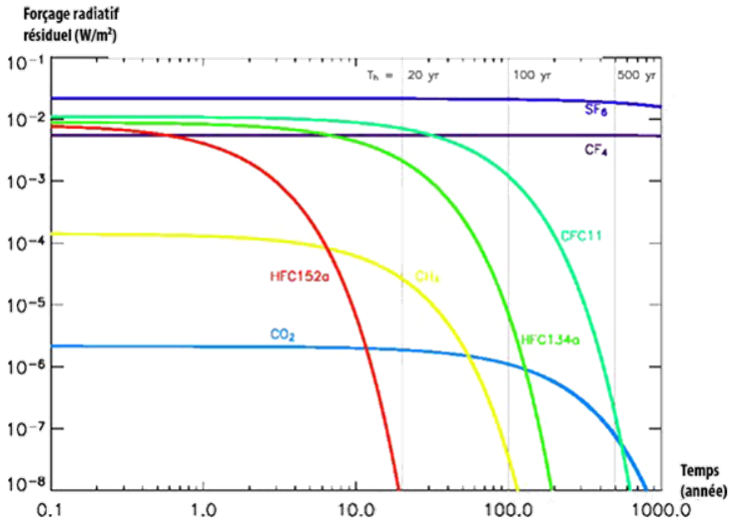
Figure 10. Residual radiative forcing, over time and in watts per square metre, from one million tonnes of gas emitted at time 0. Source: CSL. For example, it takes about a century for CO2 molecules to start disappearing.
However, the solution is relatively simple: we need to reduce our energy consumption and thus limit our carbon footprint. No, technophile beliefs or the development of new carbon storage technologies will not save us! Or in any case not in the short term, a constraint set by the urgency of global warming …
The carbon footprint of agriculture
Now let’s go into a little more detail on agriculture, which remains the attack sector of digital agriculture and Precision Agriculture. In 2019, the High Council for the Climate drew up an overview of the impacts of the main sectors of activity on greenhouse gas emissions. Agriculture comes in third place with nearly 20% of French emissions (Figure 11). All the figures presented are orders of magnitude and depend on the calculation methods and the allocation of the various emissions. Other reports will, for example, give a stronger impact of agriculture by considering that part of the emissions from the transport sector must also be allocated to agriculture since food products must be transported. This is the complexity of life cycle analyses and carbon balances. All this to say that figures must always be taken with a pinch and always repositioned in a particular context. According to the report of the High Council for the Climate, these agricultural emissions come mainly from livestock farming, crop production, agricultural machinery and greenhouse heating. Once again, I would remind you that agriculture is an extremely complex and varied sector that cannot be reduced to greenhouse gas emissions alone, but this is what we are working on.
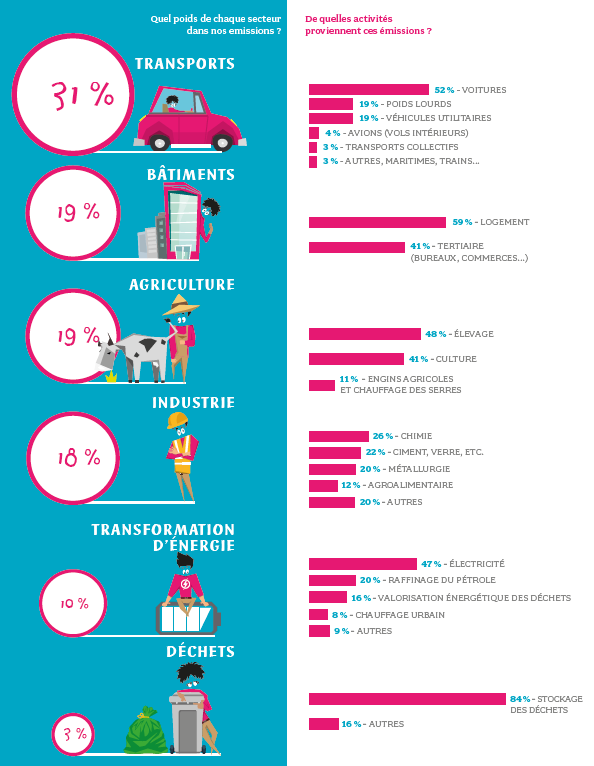
Figure 11. Share of impact of the different sectors of activity on greenhouse gases in France. Source: Report of the High Council for the Climate, 2019.
The main culprits are carbon dioxide (CO2), methane (CH4) and nitrous oxide (N2O). And it is indeed CO2 that is emitted in the greatest quantities. The problem, however, is that methane and nitrous oxide have much greater warming effects than carbon dioxide. This is notably a factor of 25 for methane and a factor of 300 for nitrous oxide! Remember, I had talked earlier about emissions in CO2 equivalent, a way that was chosen to standardize and compare the different sources of emissions. One unit of CH4 can therefore be converted into 25 units of CO2 equivalent, and one unit of N2O can be converted into 300 units of CO2 equivalent. Even if they are emitted in smaller quantities, it is difficult to neglect them… Before explaining more precisely all these sources of emissions, you can keep in mind that :
- The respiration of plants and livestock releases CO2. The photosynthesis of plants captures CO2.
- Ruminants (cattle, sheep, goats) are the source of significant methane emissions,
- Rice cultivation is also a major source of methane emissions,
- Emissions from the crop production part are mainly due to the manufacture and application of mineral nitrogen, and the use of diesel to drive agricultural machinery.
- Agricultural soils store and release carbon
Mineral nitrogen fertilizers
Let’s start by looking at the carbon footprint of crop production. This footprint can be roughly summarized as 2/3 for mineral nitrogen fertilizers (half of which is for manufacturing and half for use), and 1/3 for farm machinery and diesel use.
Nitrogen is an indispensable element for plant life. Plants use nitrogen for the synthesis of proteins, particularly chlorophyll, which enables them to photosynthesize. Nitrogen inputs are more often made in mineral than organic form because their composition, input and decomposition are better controlled.
Mineral nitrogen fertilisers are mainly manufactured using the Haber-Bosch process, named after the two Germans who developed the synthesis of ammonia (NH3) – from which all mineral nitrogen fertilisers are derived – from gaseous dinitrogen and gaseous dihidrogen (itself obtained from a steam-reforming reaction involving steam and methane). The synthesis of mineral fertilizers is problematic in that it causes a high release of CO2, particularly from the steam reforming reaction. This release of CO2 from the manufacture of mineral fertilizers is roughly equivalent to half of the emissions of mineral fertilizers (the rest being due to its use, as we will see shortly afterwards). You may tell me that since the steam reforming reaction uses methane and that methane has a stronger warming power than CO2, there is ultimately no problem. Of course there is, since the methane had to be extracted from natural deposits (and therefore the methane was not in the atmosphere). For your information, when the press or the media talk about natural gas, they are actually talking about methane! The ammonia NH3 thus synthesized by the Haber-Bosch process is then used to produce three main forms of nitrogen: urea nitrogen (contained in urea), ammonia nitrogen, and nitric nitrogen.
Nitrogen use on crops accounts for the second half of greenhouse gas emissions from inorganic nitrogen fertilizers, and involves the nitrogen cycle in all its complexity (Figure 12). We will return to livestock manure shortly when we discuss the impacts of livestock on greenhouse gas emissions. Nitrogen is supplied to plants in the three forms described above – urea, ammonia, and nitrate. Plants are able to assimilate nitrogen easily if it is present in the nitric form: nitrates NO3-. Almost all soil nitrogen, in whatever form, is therefore converted to nitrate. Ammoniacal nitrogen (ammonium NH4+) is converted into nitrate by soil bacteria in a “nitrification” reaction, and urea is first hydrolyzed into ammoniacal nitrogen by soil ureases and then into the nitric form by nitrification. Under anaerobic conditions (when there is, for example, excess water), a “denitrification” reaction by certain specific soil bacteria will lead to nitric nitrogen being transformed into nitrous oxide, and this is where greenhouse gas emissions start to occur. The IPCC considers that 1% of the nitrogen applied, following nitrification/denitrification processes, will end up as nitrous oxide. Nitrogen application and the urea hydrolysis reaction also leads to the volatilization of ammonia. The IPCC also considers the volatilization of ammonia as having a significant impact on greenhouse gases since it too will potentially be converted to nitrous oxide once it is redeposited on the soil.
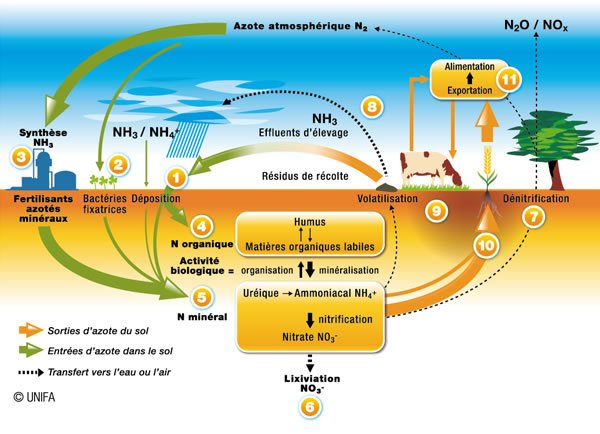
Figure 12. The nitrogen cycle. Source: CIRAD
Energy consumption of agricultural machinery
It is then all the emissions due to the regular passage of agricultural machinery, via the use of diesel, that will end up impacting crop production. The ever heavier mounted, towed or trailed implements that require more and more machine power (especially deep soil cultivation implements), the repeated passage of machinery for plant protection, soil fertilization or fertiliser spreading, are all significant sources of fossil fuel energy use.
The livestock sector
In livestock farming, the main sources of emissions are mainly from enteric fermentation of ruminants and the management of animal excreta. We will set aside here the emissions from crop production that is used to feed livestock, since we talked a lot about that just before. When cellulose-rich organic matter is ingested by ruminants, it undergoes a fermentation process during digestion in the ruminant rumen. This process is carried out by methanogenic bacteria present in the rumen, which, in order to break down this cellullosis, release gases, particularly methane (hence the name methanogenic bacteria). These gases are then belched – it is the burps and not the farts of cows that contribute to methane emissions. Animal dejecta, for their part, contribute to increasing the nitrogen stock in the soil, and therefore, in the same way as with the volatilization, nitrification, and denitrification processes described above, can lead to the generation of nitrous oxide. Anaerobic fermentation with methanogenic bacteria also takes place in animal dejecta. This means that if the dejecta are stored under conditions that favour an anaerobic environment, there will be more methane degassing. If the dejecta are stored in the open air or in conditions that favour the passage of air, it is mainly CO2 molecules that will be emitted.
Rice growing
With regard to methane degasification, we should not forget either the agricultural production in wetlands – for example, rice cultivation – which limits the movement of oxygen in the soil and therefore helps to create anaerobic conditions. Once again, methanogenic bacteria come into play in these conditions and help to release methane. When the soil is in aerobic conditions (and therefore oxygen is available), it is the so-called methanotrophic bacteria, which conversely consume the methane produced. It is primarily the greater or lesser availability of organic carbon in the soil that determines methane production, and it is the availability of methane in aerobic areas of the soil that conditions methanotrophic activity. Depending on the modes of rice production, the methanotrophic or methanogenic power of the bacteria will be more or less strong. In continuously flooded rice fields where most of the soil is in anaerobic condition, the methanogenic bacteria exert a greater activity.
Land use change
Finally, let us also talk about the impact of land-use change due to agriculture on greenhouse gases, especially carbon emissions. Plant photosynthesis contributes to the storage of carbon dioxide in the plant’s vegetative organs. This carbon is also stored in the soil in organic matter. It must be understood that this storage is temporary since it will be released when the organic matter is mineralized. The storage/destockage of carbon in soils is dynamic! The objective is therefore twofold for the reduction of greenhouse gas emissions: both to promote carbon sequestration by soils, and to minimize their destocking in carbon-rich soils through poor cropping practices and/or a change in land use. And these land-use changes are manifold. You have no doubt heard about the ravages of deforestation, but also about the destruction or conversion of grasslands – those ecosystems that store a lot of carbon – to input-intensive agricultural systems.
Some additional information
Here I wanted to provide some reading material to continue to understand the subject of the carbon footprint of agriculture. So far, I have presented the main sources of emissions from the agricultural sector, but I have not proposed any solutions to limit the amount. This is not the purpose of this post, but the solutions are very numerous and of different complexity. In the case of livestock farming, for example, as a citizen, you can think about reducing your consumption of meat (especially ruminants), reviewing livestock feed (and introducing more legumes in rations, for example), reworking herd management and the fodder system, or reviewing the management and storage of animal excrement. On the crop production side, limiting greenhouse gas emissions could be done by accelerating carbon storage in soils through conservation farming practices, reintroducing more leguminous plants in rotations to store nitrogen from the air, or even fractioning nitrogen inputs to limit losses through volatilization. Each solution implies its own set of constraints and must consider the specificities of the agricultural ecosystems in which it can be integrated.
No, the forest is not the lung of the planet. A forest stores carbon in above-ground biomass as it grows, but when it matures, there will be almost as much carbon emitted by respiration as absorbed by photosynthesis. If the carbon content of the air is very high, some forest ecosystems will be able to store a surplus of carbon, but this should not be considered significant. The principle is the same as for soil carbon storage described above, the processes of carbon storage/removal are dynamic and temporary. I would like to take this opportunity to openly criticise the solutions of carbon compensation through reforestation, a technique that is cheerfully used by all the biggest polluters of the moment. These solutions are ridiculous and misleading for several reasons. First of all, the emissions from an activity are instantaneous, whereas we will have to wait for the entire growth of the tree to have a potentially compensatory carbon storage. Second, it would also be necessary to ensure that the trees will be able to reach full growth! If, in the meantime, the tree dies or there is a fire, the tree will never be able to offset the emissions it should have offset. Finally, if all the emissions were to be offset by forests, where would we find all the room to plant these forests?! Would we be willing to convert agricultural land back into farmland? Maybe we should just stop deforesting! Finally, emissions from industrial activities are sometimes underestimated, so there is no reason why the amount of trees reforested should be appropriate. All this to say that these solutions of compensation by reforestation are absolutely aberrant and are just green-washing to avoid having to face reality.
The carbon footprint of an agricultural production will depend enormously on the way this production is consumed. Taking the example of animal husbandry, in the absence of production of other types of products, all impacts are affected to the production of young meat – in particular the breeding of broodstock (cows and their milk are needed to feed calves).
There does not seem to be a significant impact of organic production compared to conventional production, with constant production. In organic production, yields are limited and therefore require a larger agricultural area (and therefore a change in land use) for the same production. Organic production also requires more repeated machine runs (and therefore additional diesel demand). The large gains in organic production on synthetic fertilisers would not significantly compensate for the losses due to lower yields and a larger machine footprint. Once again, this thinking is stuck at constant production. And organic enthusiasts will criticize here the weakness of a carbon-only approach (and they will be right).
The transport of food products, unless it is done by plane, is quite unimportant in relation to the whole chain of agricultural production in terms of greenhouse gases. It is essentially land use change, production and on-farm cultivation that have the greatest impact (Figure 13).
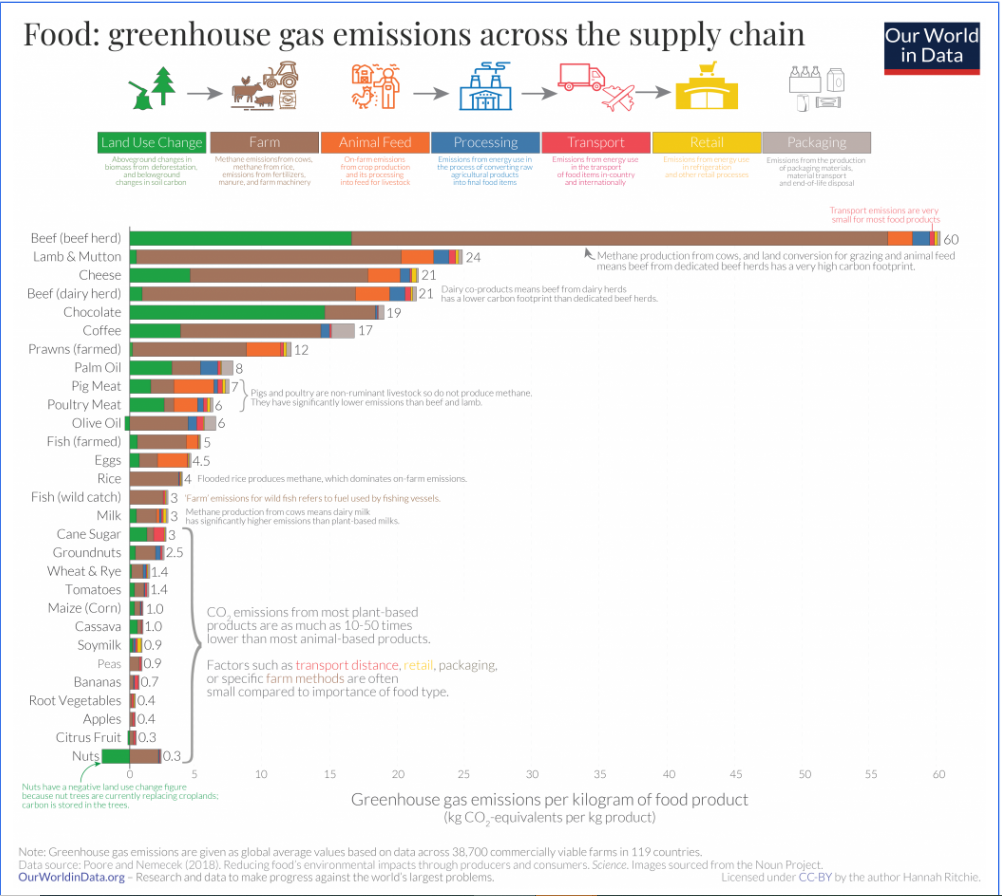
Figure 13. Greenhouse gas emissions in agriculture, over the entire production chain. Source: Our World in Data
What about digital agriculture in all this?
A first point on the carbon footprint of digital technology
Once again, and in order to get to the bottom of the abscess from the outset, just as in the agricultural sector, digital technology cannot be reduced to greenhouse gases because it also affects access to and sharing of information, notions of social openness and the establishment of relations between people, or because it offers hitherto unrivalled computing capacities. Nevertheless, the greenhouse gas angle remains extremely important to consider as well.
In a note on the carbon footprint of digital technology, Arcep reminds us that digital solutions can generally be considered as a vector of innovation allowing concrete responses to environmental challenges. By enabling data collection and developing analysis capacities, digital technology would help quantify the impacts of different activities on the environment. In particular, digital technology contributes to the intelligent adaptation of building thermal systems, the detection and measurement of losses on electricity, gas or water networks, and the sharing of living spaces and their functions. Nevertheless, still according to the Arcep, the question of the impact of the digital sector itself arises. The impact of digital technology is relatively intangible. We often hear about dematerialization, or the cloud, all notions that lead us to believe that digital information is light, invisible, almost non-existent. However, digital is there, and its impact is far from negligible.
- The digital sector currently accounts for 4% of global CO2 emissions, i.e. more than the aviation sector, and is growing much faster than other sectors; around +8% per year is expected in the coming years, with an explosion of the Internet of Things and global traffic of 50% by 2022 (Figure 14). It may nevertheless be pointed out that some 4.5 billion Internet users worldwide, i.e. more than half of humanity, have access to digital technology, unlike aviation, for which 80% of the world’s population has never yet taken a plane. Frédéric Bordage, in his report on the environmental footprint of digital technology, estimates that the digital universe is made up of 34 billion pieces of equipment for 4.1 billion users, or 8 pieces of equipment per user, with strong disparities by geographical area.
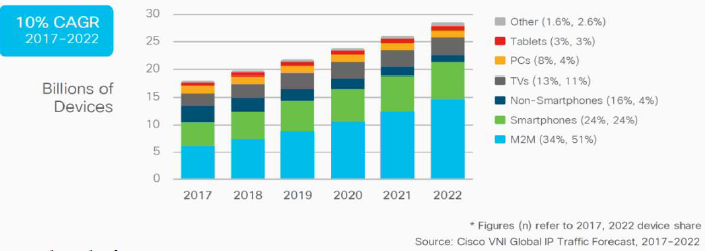
Figure 14. The evolution of the number of digital tools between 2017 and 2022 in billions of devices. Source: Cisco VNI Global IP Traffic Forecast, 2017-2022
- Digital technology accounts for 10% of the world’s electricity consumption. Returning to the energy mix discussed in the previous section, it all depends on which energy source the electricity is generated from.
- The carbon footprint of digital technology crosses borders. Remember the difference between the carbon footprint and the carbon footprint of a country described at the beginning of this post. This is especially true with digital tools and applications.
- The world’s digital footprint is five times greater than the French car fleet. It is the weight and not the emissions that are considered here (GreenIT, 2019). Ademe takes as an example a computer which alone would be responsible for the consumption of 1.7 tons of materials, including 1.5 tons of water, 22kg of chemicals and 240 km of fossil fuels. And that’s without counting on the environmental impacts (drying up of water, soil erosion, fragmentation of territories, multiple pollution, loss of biodiversity), wars and armed conflicts, and child labour generated by the extraction of these resources.
- An impressive diversity of metals is needed to make the digital tools we use every day. One striking example, again around a computer, makes one think (Figure 15)
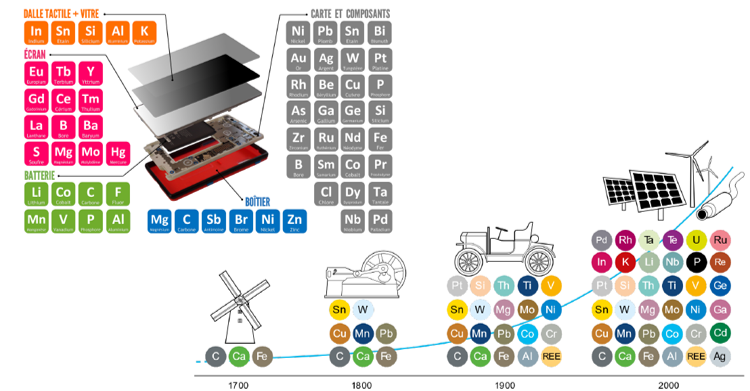
Figure 15. The different components of a computer. Source: Zepf, V. (2014). Engineers Without Borders
The growing demand for digital facilities and devices, together with the significant amount of materials, materials and metals required for these infrastructures, raises many questions. First of all, there is the issue of the criticality of the materials used. Will there be enough metals to meet this demand, and if so, how much longer will these metals be able to be exploited at the current speed? (Figure 16).
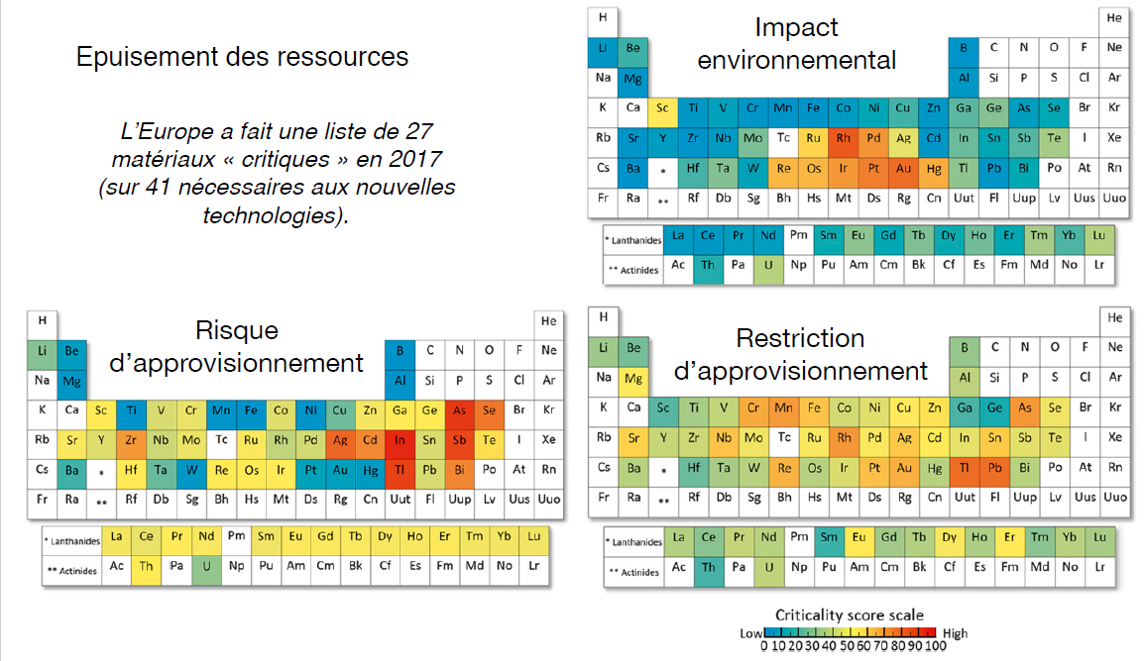
Figure 16. The possible depletion of metals and metalloids. Source: Graedel et al (2015). Criticity of metals and metalloids. Proceedings of the National Academy of Sciences and IVL (2019). E-waste and Raw Materials: from Environmental issues to business models
The treatment of all this electronic waste also arises! The environmental protection agency in the United States, for example, estimates that only 20% of electronic waste would be recycled. In France, WEEE (or D3E) regulations on waste electrical and electronic equipment have been in place since the 2000s. In 2019, the objective is to either increase to 65% of the average weight of EEEs placed on the market over the last three years or to 85% of WEEE produced by weight (Ministry of Ecological and Solidarity Transition). The treatment of electronic waste has also seen the arrival of illegal treatment channels, as shown in the following figure. The treatment and recycling of e-waste cannot in any case be considered as a satisfactory solution. Recycling is first of all very expensive, in exponential demand, and could produce many rebound effects (users could consume even more digital tools by justifying its recycling). Recycling remains a support, but the fight against digital pollution cannot be limited to it.

Figure 17. Known and suspected illegal treatment channels for e-waste. Yellow: known source. Red: Known destination. Purple: Suspected destination. Source: Efthymiou et al (2016).
Direct and indirect effects of digital
To consider the environmental pollution of digital technology, it’s always the same thing, you have to consider digital technology over its entire life cycle, i.e. from its manufacture to its end of life after being used. The Shift Project, in its “Lean ICT” report for 2019, shows that about half of the carbon footprint of digital technology is due to the manufacture of terminals (computers, tablets, smartphones), and the other half is due to the infrastructures that allow information to pass through (networks, data centers, etc.). Manufacturing is therefore just as important as the use of digital technology. When we consider 1 hour of streaming video, we should not only consider the use of the network, but also the fact that we had to build data centers to store the videos and computers to play them. Frédéric Bordage, in his Green IT report of 2019, classifies the sources of impact, in descending order, as follows: (1) Manufacturing of user equipment; (2) Electricity consumption of user equipment; (3) Electricity consumption of the network; (4) Electricity consumption of computer centres; (5) Manufacturing of network equipment; (6) Manufacturing of equipment hosted by computer centres (servers, etc.).
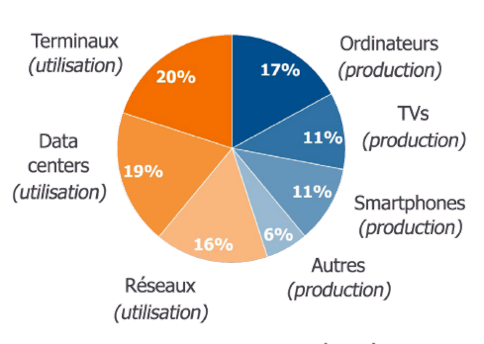
Figure 18. Carbon footprint of the digital. Source: Shift Project Report, 2019.
The digital carbon footprint is complemented by a host of factors that will drive either the manufacture or use of electronic devices:
- For example, programmed obsolescence – whether functional, planned or incompatible – will lead to the need to renew electronic equipment more regularly than planned.
- This is also the problem of the rebound effect. You may agree on increasing the energy efficiency of electronic equipment. Strangely enough, despite this improved efficiency, emissions from the digital sector are not going down. This is simply due to the fact that there are more and more new equipment being manufactured, and more interconnected objects… The decrease in the carbon cost of unit use does not compensate for the increase in the number of terminals used and their associated use. This paradox had already been observed a long time ago by the English economist and logician William Stanley Jevons (Jevons Paradox) about the rapidly growing consumption of coal despite the increasing energy efficiency of steam engines (“It is wholly a confusion of ideas to suppose that the economical use of fuel is equivalent to a diminished consumption. The very contrary is the truth” in The Coal Question; An Inquiry Concerning the Progress of the Nation, and the Probable Exhaustion of Our Coal Mines, Jevons, 1865).
- Digital technology also implies new uses. This is the case, for example, with carpooling applications. The question then arises: what would the users of these applications have done if they had not existed? If the answer is that these people would not have moved or would have taken a more carbon-free mode of transport, then the new use of digital technology leads to an increase in greenhouse gases. This is the problem of pollution carry-over or modal shift.
- Let us also add to this the fact that digital technology accelerates the flows – of goods, people, finance – and also production processes, all of which, unsurprisingly, contribute to an acceleration of greenhouse gas emissions. To put it another way, digital is an industry that is highly dependent on global transport and logistics.
Can digital technology reduce greenhouse gas emissions? The question remains unanswered and the working hypotheses are fraught with consequences. The impact of the digital sector is not easy to quantify, that’s for sure. Recent criticisms of the Shift Project’s report on the impact of online video bear witness to this. How can we accurately estimate how much each link in the chain consumes, from the server that contains the video to the network infrastructure that delivers it to individuals, to the equipment that those same individuals use to watch it? Some impacts are also difficult to quantify only in the short term, and it is necessary to wait until we have a sufficiently long history to really measure the advantages and/or disadvantages of a digital solution. And all the more so in a sector such as agriculture, which reasons by season or by crop rotation.
Digital technology does not necessarily reduce carbon emissions, as this simple example from a study by the firm Carbone 4 on the dematerialisation of invoices when they are printed at home shows (Figure 19). Some will criticise the fact that a dematerialised invoice has no interest in being printed, but it is nevertheless used.
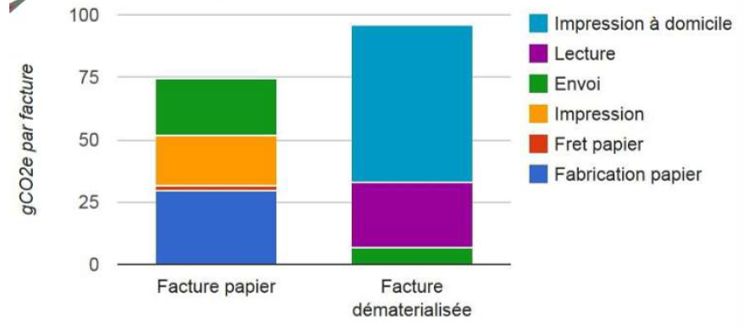
Figure 19. Greenhouse gas emissions from billing with home printing. Source: Carbon 4.
Digital players have the secret hope that digital tools and infrastructures will make it possible to decouple global GDP from energy consumption, and consequently from greenhouse gas emissions (we saw above that it was all about energy). However, at present, there would be no visible mitigation effect on sectors that have been heavily affected by digital technology, such as paper production, transport, international tourism, or telecommunications (Source: Steffen et al. (2015) The trajectory of the Anthropocene: The Great Acceleration). The International Energy Agency, in November 2019, even painted a contrasting picture of the contribution of digital technologies on the subject: “More evidence is needed on how digital technologies could combine to deliver system-wide improvements, and how rebound effects might curtail their benefits if the spread of digital devices increases energy use”. When you see what is happening on the web in one minute, there is indeed cause for concern (Figure 20).
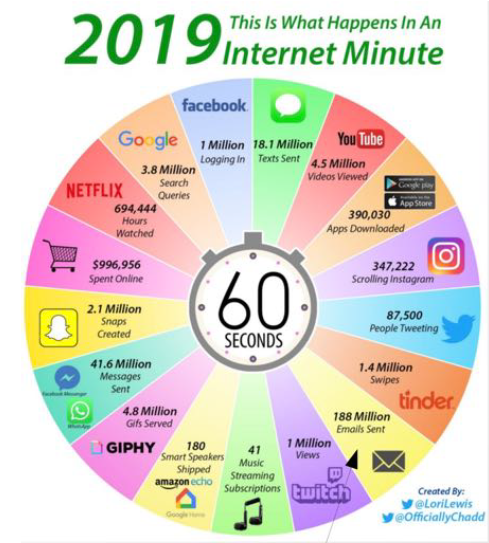
Figure 20: What’s happening on the Internet every minute in 2019. Infographics are also available for previous years.
Let’s try to make the link between digital and the agricultural sector.
Digital agriculture is regularly put forward as one of the solutions for advancing the agricultural sector, allowing :
- Optimize resource management through the deployment of new tools to enable farmers to improve the technical, economic and environmental performance of their farms while remaining productive in a changing climate.
- Make the integration of logistics processes through the digital integration of all potential stages of the food process, from crop genetics to the management of transport logistics and business-consumer relations, and
As mentioned in the introduction, are all the potential savings in energy and advanced emissions significantly greater than the cost of digital itself? For the moment, the answer is very simple: we know absolutely nothing about it. And we don’t know because we don’t quantify these potential savings that everyone is talking about. Since the impact of digital technology in agriculture is neither monitored nor quantified, how can we say whether digital technology is helping to reduce greenhouse gas emissions? Very few players have yet taken up the question.
The use of digital technology in agriculture should lead us to reflect on the carbon footprint of digital agriculture:
Artificial intelligence and learning algorithms
Artificial intelligence, and some of its branches, particularly deep learning, have appeared in agriculture for complex applications: automatic disease detection, yield prediction, soil use classification (AgroTIC Chair, 2018). However, the carbon footprint of this intelligence has been relatively little looked at so far. In a recent rather provocative paper (Strubbel et al., 2019), the authors attempted, for the first time, to quantify the economic and carbon costs of several artificial intelligence training models. The authors trained the algorithms on very large datasets, testing many combinations of hyperparameters, and counted the number of hours their microprocessors were used. According to the authors, while model training (for a fixed set of hyperparameters) seems relatively inexpensive, full training of their algorithm is starting to be much more expensive – some full training of algorithms commonly used on GPUs can emit as much as five cars over their entire lifecycle. According to NVIDIA, the company that invented the GPU, the carbon cost of this intelligence is not so much in the training but in the prediction of new data sets, at 80 or even 90%. Once the algorithm has been trained, it can be effectively used countless times. Without any possible comparison with the autonomous car, we could nevertheless imagine in agriculture, embedded intelligence on agricultural machines that could collect a lot of images on crop development, or the evolution of diseases, with a very significant carbon impact. In the scientific community, some authors are beginning to push towards measuring the energy impact of these learning algorithms (Garcia-Martin et al., 2019). Several companies are also starting to do deep learning on tools other than GPUs to gain performance.
Strubell and his co-authors, in addition to the numerical pollution of his trainings, also highlight the prohibitive financial cost of the trainings (since energy and processors have to be paid to run the algorithms) which can introduce biases in the competition; some new companies simply cannot afford to compete with algorithms already in place at companies such as Google or Facebook. Between a nice server (with several tens of GB of RAM, and a few processors), and a GPU to run an artificial intelligence in a reasonable way, the price is clearly not the same…
Data centers
Data acquisition tools in agriculture (satellite imagery, on-board sensors, etc.) generate an ever-increasing flow of information that must be stored in data centers. With ever finer spatial and temporal resolutions, satellite imagery is perhaps the most demanding source of information in place. Once again, the carbon footprint of digital technology is not just about its use! To store an image, you need data centers – which you have to build at some point. Data centers around the world are estimated to consume 200 terrawatt hours per year, or 1% of global electricity demand, and contribute 0.3% of greenhouse gas emissions. It should be noted that most of the energy used in data centers comes from servers and cooling systems. GreenPeace published a report in 2019 also highlighting the significant emissions from Chinese data centres, which run mainly on coal-fired power.
In light of the expected increase in digital usage and the explosion in the number of devices on the market, many voices have been raised and alarming reports have been made about the likely emissions from data centers in the future. However, a recent article in the journal Science (Masanet et al., 2020) tried to set the record straight by showing that data centre energy consumption had only increased by 6% between 2010 and 2018 due to improvements in data centre energy performance (Figure 21). These improvements include energy efficiency of servers and storage disks, the use of server virtualization software, and the migration of computing instances to large cloud and hyperscalar class data centers that use ultra-efficient cooling systems.
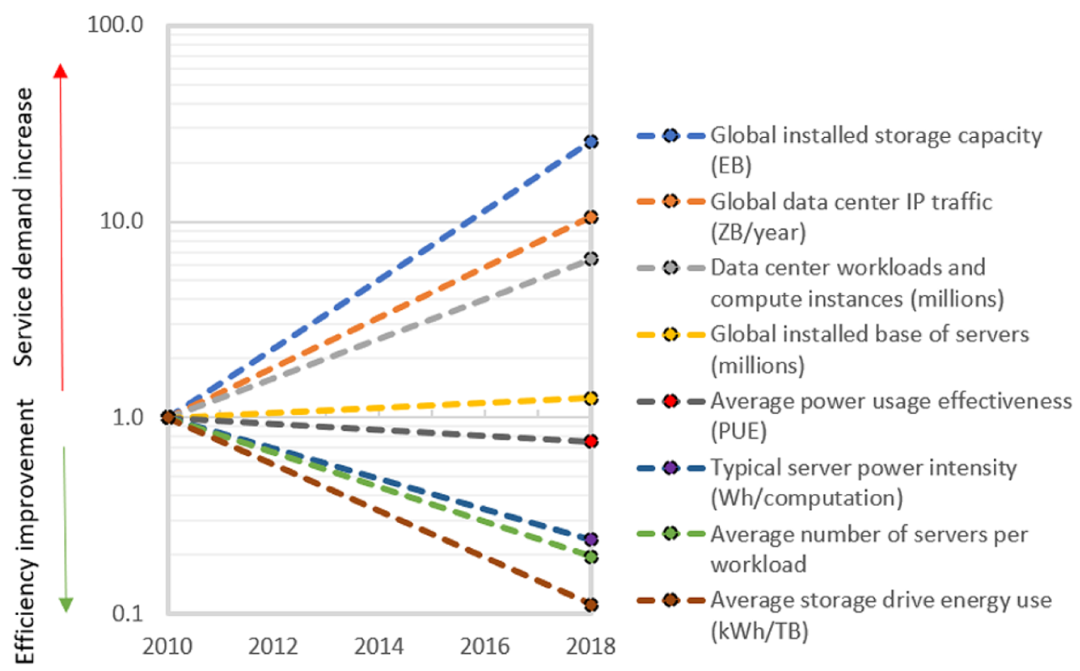
Figure 21. Improving energy efficiency in data centers. Source: Masanet et al, (2020), and energy innovation.
Some companies and hosting providers continue to look for other ways to improve, such as providing renewable energy to their data centers, rethinking the installation of data centers in cold regions, or pooling the energy released to district heating networks. Free cooling solutions can reduce the energy consumption of air conditioning and thus improve the energy efficiency of data centers. They could be complemented by the development of equipment that is more resilient to high temperatures and therefore requires less cooling (Arcep, 2019). Others will work on how to store data: (i) “hot” data stored on a disk that is constantly spinning, and continues to spin so that the data remains instantly accessible to those who watch it, (ii) “warm” data stored on a disk that spins only occasionally, requiring less energy, and (iii) “cold” data stored on an optical tape or disk. In the longer term, the boundary between data centres and telecommunications networks is likely to become more blurred. For example, Multi-Access Edge Cloud (or MEC) allows some of the functionality of data centres to be moved into the operator network so that they are closer to users (and reduce latency). The impact on greenhouse gas emissions of such a development is still uncertain (Arcep, 2019).
All these improvements are certainly a step in the right direction; but the problem remains the same, we are still facing rebound effects and new uses. For example, even though cold data storage is relatively energy efficient, when billions of users store data year after year in the cloud, everything is stored in data centers that consume energy. And that’s not to mention the fact that every piece of data is copied over and over again. Improving energy efficiency is necessary but not sufficient, it must be accompanied by digital sobriety.
Blockchain
Defined as a technology for storing and transmitting information that is transparent, secure, and operates without a central control body, the blockchain has found interest among players in the agricultural world. Possible examples include traceability and transparency in the supply chain, finer and more secure management of agricultural insurance, management of consents for the use of farm data, or the sale of foodstuffs and payment to producers (AgroTIC Chair, 2017). The blockain relies on the use of numerous cryptomoney systems (Bitcoin, Ethereum, Litecoin…) and undermining its cryptomoney systems requires significant energy consumption. Krause and Tolaymat (2018) estimate that between 2016 and 2018, the mining of four cryptomoney (Bitcoin, Ethereum, Litecoin and Monero) consumed more energy than mining (aluminium, copper, gold) to produce an equivalent market value. Already in 2014, O’Dwyer and Malone warned that the mining of Bitcoin required an energy consumption comparable to Ireland’s electricity consumption. Stoll et al (2019) estimate that emissions from Bitcoin mining are between the levels produced by the nations of Jordan and Sri Lanka, which is roughly comparable to the level of Kansas City.
Bitcoin mining is very energy intensive because it involves solving complex mathematical equations, many people (the miners) try to find the solution, and only the miner who manages to verify the transactions in the block of strings is rewarded with Bitcoin (a validation method called “proof of work” in English). Even if some cryptomoney systems appear to be more energy efficient, such as Ethereum, which uses another validation method than the “proof of work” (the “proof of stake”), it goes without saying that the energy consumption of blockchain technologies is quite frightening. Even if the applications are potentially very relevant, even in agriculture, does the carbon cost of these solutions deserve so much attention? According to this author, efforts need to be made on legal and policy tools to reduce the energy consumption of blockchain technologies – a sector that he nevertheless considers quite valuable (Truby, 2018).
How should we position ourselves in the face of 5G?
In the agricultural sector, very high speed connectivity enriches the possibilities of automation, allowing even the global supervision of farms, in that it allows the connection of all farm tools. Such a deployment also requires sufficiently low latencies to ensure the remote management of equipment, which, if one can imagine it, could be implemented once 5G is installed. The Arcep, in a recent note in 2020 on connected agriculture, adds that very high speeds “would offer better responsiveness in farmers’ decision-making. The combination of real-time analysis of parameters and contextual information accessible on open databases (weather, soil mapping, etc.) can enable immediate action on a farm when agricultural equipment is installed. Real-time processing of high-definition images could then be envisaged in order to develop expert systems that update their decisions based on contextual data. More generally, higher throughputs would make it possible to envisage the systematic use of large databases. The consolidation of agricultural data on broad geographical and temporal scales would thus make it possible to implement learning agronomic models that are continuously optimized and capable of adapting to dynamic contexts. Very high-speed connectivity then offers the dual advantage of providing access to high-performance fleet supervision and control tools and dynamic decision support tools”.
Nevertheless, the impact of digital technology is not only in its use, but also in its production (terminals, network infrastructures – see Figure 18). If 5G is so problematic, it is because it can be expected to generate enormous rebound effects (Figure 22), but it is also, from the outset, for identical uses, because it requires the replacement of all hardware! New smartphones are needed to be able to receive 5G streams, and new antennas are needed to transmit in 5G because the currently deployed antennas are not capable of doing so (note that 5G antennas will in fact add to the existing 2G, 3G and 4G antennas). At a minimum, 5G antennas will need to be manufactured to match, if not much more than the number of 4G antennas already deployed in the territories, as by construction, 5G antennas will serve smaller areas than the existing 4G antennas. If the old modes of telecommunication are still in operation, and the new modes are not yet in operation – or are only at the beginning of their development like 5G – and the new systems are really less transmitting than the old ones (in their usage), should these new modes of telecommunication be put in place or finished? Even with constant use, the answer is not written in advance, in one direction or another. In view of the additional ecological cost of manufacturing a device (Figure 18), wouldn’t the only thing to do be simply to extend the life of the existing device for as long as possible?
Regarding the rebound effects, it is true that the power consumption is less important between the phone and the 5G antenna (the consumption would be 3.5 times more electricity for 5 times more bandwidth, therefore more efficient) but since there are many more antennas, the total consumption is about three times more important than with 4G (the Chinese would currently pay for it). According to Arcep, the implementation of 5G could “lead to an increase in operators’ GHG emissions since it was estimated during a hearing that the improvement in energy efficiency will not be sufficient, in the long term, to offset the increase in traffic” (Arcep, 2019). And Arcep adds that “for the sake of economy, operators may prefer to deploy very high-speed access using wireless technologies rather than fibre, or even to offer it as a complement to ADSL” (Arcep, 2019). This is notably justified by the increase in speeds allowed by 4G and 5G. However, this type of access technology consumes more energy than fibre, especially when usage evolves thanks to the increase in bandwidth allowed” (Arcep, 2019).
5G also raises the question of the use made of digital technology. And this use is unfortunately far from sober. Do we really need to scale up the video stream in relation to the bandwidth by watching Youtube in 2k instead of HD, while having more ads and high quality images on the Web? Can’t full HD be enough, even if you have an option to increase the quality? The problem of digital sobriety is not limited to a technological problem, it is also a problem of utility and human need.
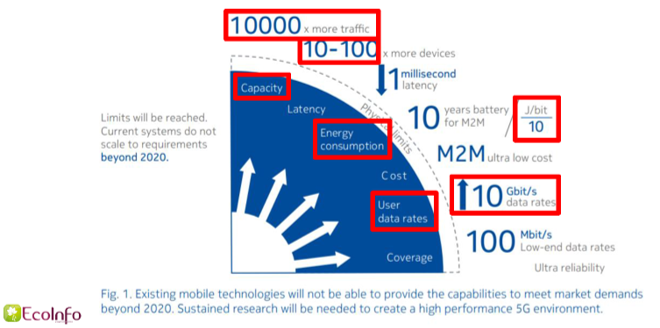
Figure 22. The 5G and the anticipation of the rebound effect. Source: EcoInfo
Moving towards digital sobriety
In the field of agriculture, digital technologies are extremely numerous and their carbon impact does not seem at all negligible. Some of them have been presented in more detail (artificial intelligence, block chain, data centers, 5G), but it is without forgetting robotics and its embedded intelligence (robot construction, embedded learning algorithms…), sensors and sensor networks (sensor construction, information sending…), or mobile applications (mobile development…). Despite the energy efficiency that has been presented on several occasions, the rebound effects and the increase in uses require a commitment to digital sobriety and a decrease in digital consumption if we wish to follow a greenhouse gas reduction trajectory. On digital agriculture and precision agriculture, here are some humble thoughts:
- What about the spatial and temporal resolution of the data? Do we really need to have ever finer and more precise data for the applications envisaged? Do the gains in resolution really justify the higher storage and processing costs of these data?
- Is there necessarily a need for real-time data processing?
- Is there a constant need for technological innovation in agriculture? Can we not seek first and foremost to transfer and extend solutions that already work? Shouldn’t we, each time a project is imagined, make clear how it will be transferred to the sector?
- Significant efforts should be made to monitor carbon emissions in agriculture using digital tools AND at the same time monitor the emissions of this sector by ensuring that :
- The companies involved in AgTech keep carbon accounts
- Farm management information systems and AgTech companies collecting agricultural data make it easy to calculate carbon emissions from the data collected. These data are of general interest, and an effort must also be made to open up these data.
- Sensors be developed to quantify and monitor carbon storage in soils.
- To pool the skills of AgTech companies with companies and/or research centres involved in life cycle assessment. Databases of life cycle inventories of agricultural products, for example AgriBalyse, should be used. A new version of AgriBalyse should be released in 2020 with impact analyses around crop succession and rotation.
- The collection of information must be shared as much as possible with the farming practices and operations that must take place anyway. For example, it is more relevant from an energy point of view to have an on-board sensor on a machine carrying out a cropping operation, than to carry out a machine passage specifically for collecting information.
- It is necessary to privilege as much as possible low flow networks in agriculture (for certain crops, it is true that the question does not really arise).
- We must ensure that the digital solutions and tools deployed in agriculture :
- Follow good software eco-design practices (limiting the use of resources, data traffic or memory; rethinking the hosting of applications and data; rethinking the integration of connected objects in digital services…), in particular by avoiding creating “obesoftware” (obese software). Numerous works and white papers by GreenIT or the Green IT Alliance (AGIT) point in this direction. Digital eco-design labels could see the light of day.
- May be long-lasting, easily repairable
By way of conclusion
It is difficult to conclude on such a broad topic, and explored in a partial way (we have already discussed the fact that agriculture and digital cannot simply boil down to greenhouse gases). Nevertheless, perhaps I could conclude on the importance of the notions of frugality and sobriety, both in terms of usage, but also in terms of equipping people with digital tools, which, as we have seen, is far from negligible. In order to act, on the trajectory of greenhouse gases, it is necessary to take into account both the benefits, but also the direct negative effects and all the other indirect effects (rebounds, new uses…) of new solutions or services imagined. We must be very clear on the fact that there is no evidence without analysis or study. It is currently not possible to conclude on the positive impact of digital solutions on agriculture if this impact is not clearly measured! Finally, it should be ensured that the carbon footprint of a project on the environment is considered as much as its cost, before the project is launched. But, in the end, wouldn’t the question be: Can we do without digital?
Bibliographie
Articles et rapports
- Ademe (2019). Au quotidien, la face cachée du numérique – Réduire les impacts du numérique au quotidien
- Alliance Green IT (AGIT) [2015]. Baromètre des pratiques Green IT des entreprises en France.
- Alliance Green IT (AGIT) [2017]. Baromètre des pratiques Green IT des entreprises en France.
- Alliance Green IT (AGIT) [2017]. Livre blanc – L’écoconception des services numériques.
- Alliance Green IT (AGIT) [2019]. Pour un numérique plus responsable au quotidien en 3 épisodes
- Arcep (2019). Réseaux du futur. Note n°5 L’empreinte carbone du numérique
- Arcep (2020). Réseaux du futur. Note n°7 L’agriculture connectée.
- Chaire AgroTIC (2017). Blockchain et agriculture – Comprendre, explorer, s’interroger.
- Chaire AgroTIC (2018). Deep Learning et agriculture – Comprendre le potentiel et les défis à relever
- Cleanfox (2015). La pollution numérique – livret blanc
- Efthymiou et al. (2016). Quantifying the effect of macro-economic and social factors on illegal e-waste trade. International journal of Environmental Research on Public Health.
- Garcia-Martin, E., Rodriguez, C., Riley, G., Grahn, H. (2019). Estimation of energy consumption in machine learning. Journal of Parallel and Distributed Computing, 134, 75-88
- GIEC (2019). Réchauffement planétaire de 1.5°C. Résumé à l’attention des décideurs.
- GreenConcept (2020). Livre blanc de l’action – écoconception numérique
- GreenIT (2019). L’empreinte environnementale du numérique mondial
- GreenPeace (2015). Clicking Clean: A Guide to Building the Green Internet
- GreenPeace (2019). Powering the cloud – How How China’s Internet Industry Can Shift to Renewable Energy
- Haut Conseil pour le Climat (2019). Version Grand Public du rapport annuel Neutralité Carbone de juin 2019 – Agir en cohérence avec ses ambitions.
- Iddri, FING, WWF France, Green IT (2018). Livre blanc – Numérique et environnement
- Krause, M., and Tolaymat, T. (2018). Quantification of energy and carbon costs for mining cryptocurrencies. Nature Sustainability, 1, 711-718.
- Masanet, E., Shehabi, A., Lei, N., Smith, S., Koomey, J. (2020). Recalibrating global data center energy-use estimates. Science, 367, 984-986
- O’Dwyer, K., Malone, D. (2014). Bitcoin Mining and its Energy Footprint. ISSC 2014 / CIICT 2014, Limerick.
- Réseau Action Climat et Fondation Nicolas Hulot (2010). Agriculture et gaz à effet de serre: état des lieux et perspectives
- Muller, D. (2020). Chapitre 2 : L’impact environnemental du numérique
- Stoll, C., Klaaßen, L., Gallersdörfer, U. (2019). The Carbon Footprint of Bitcoin. Joule, 7, 1647-1661
- Strubbel, E., Ganesh, A., McCallum, A. (2019). Energy and Policy Considerations for Deep Learning in NLP. In the 57th Annual Meeting of the Association for Computational Linguistics (ACL). Florence, Italy
- The Shift Project (2018). Lean ICT – Pour une sobriété numérique
- Trubby, J. (2018). Decarbonizing Bitcoin: Law and policy choices for reducing the energy consumption of Blockchain technologies and digital currencies. Energy Research and Social Science, 44, 399-410.
Webographie
- Cnet :
- Ecoinfo :
- Infographies variées :
- https://www.cnews.fr/monde/2020-02-04/limpact-de-la-pollution-numerique-sur-la-planete-en-infographie-924071
- https://www.archimag.com/demat-cloud/2019/11/20/ecologie-numerique-chiffres-infographie-conseils-dematerialisation-verte
- https://climatecare.org/infographic-the-carbon-footprint-of-the-internet/
- Le monde diplomatique :
- Our World in Data :
- The Conversation :
- Towards Data Science
- Youmatter :
Vidéos :
- Thinkerview : https://www.youtube.com/user/thinkerview
- Guillaume Pitron – L’enfumage de la transition écologique
- Jean Marc Jancovici et Philippe Bihouix – Croissance et effondrement
- Pablo Servigne – Effondrement de la civilisation ?
- Philippe Bihouix – Prophète de l’apocalypse ?
Outils de suivi d’impact des activités numériques :
- L’extension Carbonanalyzer du Shift project basé sur le modèle 1byte : https://theshiftproject.org/carbonalyser-extension-navigateur/
- L’outil Cleanfox pour le suivi de l’impact de ses e-mails : https://www.cleanfox.io/fr/
Support Aspexit’s blog posts on TIPEEE
A small donation to continue to offer quality content and to always share and popularize knowledge =) ?
