Weeds, insects, pests, diseases! These bio-aggressors are the main subject of this blog entry. Once again, the panorama of digital technologies to support their management is particularly broad: fixed and on-board sensors, agro-meteorological models, more or less advanced decision-support tools, agri-equipment and robotics…
These digital tools meet a variety of objectives:
- Monitor the territory (in real or delayed time) for emerging risks.
- Delay and/or avoid phytosanitary treatments
- Assess the risk of a disease outbreak
- Initialize agronomic model settings
- Check that an agronomic model does not drift too much
- Define control zones or sentinel plots
- Save inspection time for in-situ pest monitoring
- ….
All these objectives bring us back to different spatial dimensions and temporalities, namely at least the detection, identification, anticipation and prediction of pests.
Generally speaking, pest management is particularly complex. Climate change, by affecting the development cycles and distribution areas of pests, will not help matters.
It has to be said that the skills of agricultural players are often siloed by type of pest, as each theme is so different. It’s hard to find people with a systemic vision of the subject, which is also reflected in the type of digital technologies that are often said to be “tactical”.
We’re sorely lacking in fundamental knowledge about bio-aggressors, something that entomologists, plant pathologists and weed scientists could provide, but they’re nowhere to be found.
As usual, I’d like to emphasize that digital tools are just one of the ways in, and that there are many other technical levers (which digital technologies can sometimes accompany) that we’ll only touch on in passing in this specific dossier.
I would like to thank the Alliance Harvest patronage chair, without which this dossier would certainly not have seen the light of day. Their contribution, both financial and reflective, has enabled us to launch initial interviews and make progress in the dizzying ecosystem of digital tools for pest and disease management. I’d like to thank Aurélie Cornuejols, Frédéric Salvi and Sophie Martin for their confidence in this work.
This dossier on pest management is also an opportunity to capitalize on all the knowledge that is beginning to be capitalized on the directory of digital tools for agriculture. In addition to serving as a collaborative monitoring tool, this platform is now being used to take a step back from existing digital tools and identify trends.
As usual, for readers of the blog, this article is based on video interviews with players in the sector (whose names you’ll find at the end of the article), whom I’d like to thank for their time. Several articles, reports and webinars have been used to supplement the feedback from the interviews.
This report in no way commits the players interviewed or the Alliance Harvest. Through the interviews, they have all contributed to the evolution of our thinking. The players do not necessarily agree with everything that is said in this dossier. This dossier has been written completely independently. The financing of this work has not given rise to any writing restrictions.
Enjoy your reading!
Soutenez Agriculture et numérique – Blog Aspexit sur TipeeeImportant Preamble
This blog entry focuses on the management of bio-aggressors – mainly weeds, insects and diseases – in crop production (topics such as game damage or other biotic damage have not been covered). The direction of this work was drawn by the Harvest Alliance, contributor and funder of this deciphering. Nevertheless, I have not been constrained in any way in my editorial line. The dossier focuses on field crops in particular, but does not prevent me from delving into what is happening in other agricultural sectors.
The work I’ve done on this blog entry has made me aware of the wide range of skills needed to manage pests and diseases. These skills are often siloed by type of pest among the players interviewed, making it relatively difficult to find people with a systemic vision of crop protection.
I’m still an agronomist by training, with a focus on digital technologies applied to agriculture. I’m not an entomologist, weed scientist or plant pathologist. The aim of this blog is not to provide a detailed understanding of the mechanisms involved and the development cycles of weeds, insects, pests and diseases. We’ll introduce the issues surrounding the use of plant protection products, insofar as a call for their reduction is necessary, but I’ll say very little about the many other technical levers (false seeding, mechanical weeding, rootstocks, mating disruption, longer rotations, etc.) that can be mobilized to manage bioaggressors. I’m not really in a position to describe all these levers in detail, so I’ll refer interested readers to the relevant literature.
This work approaches pest management from the angle of digital technologies. I emphasize that digital tools are just one way of supporting pest management in agriculture, although there are of course many others (see Figure 0). The panorama of digital technologies is particularly broad in these areas, especially with regard to weeds.
| Levers | Examples |
| Varietal selection | New varieties, hardy seeds or mixtures of varieties |
| Biocontrol | Biocontrol, trap plants, auxiliary insects, sterile insects, gaseous ozone, allomones, micro-organisms, push and pull |
| Biostimulant | Anti-stress, strengthening of natural defenses, biocompost, ultraviolet, recombinant enzymes |
| Precision | Digital sensors, drone, epidemiological surveillance, Low Pressure |
| Mechanization | Ploughing, mechanical weeding, physical barriers, nets, mass trapping |
| Crop management | Diversification of rotations, false sowing, shifting of the sowing date, crop associations, reduction in the size of plots, distance between plots, park of crops in the landscape |
| Agroecological infrastructure | Hedge, agroforestry, melliferous fallow, pond |
Figure 0: Example of levers that can be activated to manage pests and diseases. Source: SGPE (2024)
I’d like to finish by reminding you that I write popularization dossiers, not scientific articles (although I have written some in the past). Nevertheless, these dossiers are well researched and detailed. They are a synthesis (sometimes only slightly revised) of what I have read and/or heard from my interviewees. For me, popularization is not an oversimplification of reality, but a way of making science more accessible. I try to make this work as objective as possible, even if I do remain committed to my writing.
Please keep this in mind as you read this work!
Heavy dependence on the use of plant protection products
Phytosanitary products (herbicides, insecticides, bactericides, acaricides, nematocides, etc.) are used to protect plants and crop products by destroying or repelling undesirable harmful organisms (including undesirable plants) or by acting on the vital processes of plants (SGPE, 2024). In this way, these products help to secure food production by preventing yield losses and excessive biotic damage (although the contribution of phytosanitary products could be put into perspective by looking at the long term).
In France, the use of active substances outside biocontrol and organic farming is said to be on the decline, even if the rates of use remain highly variable between active substances (Figure 1. BNVD, 2022). In any case, this is the conclusion reached by the government following the presentation of the French Ecophyto 2030 strategy in early 2024.
On the other hand, biocontrol products and those used in organic farming would appear to be on the rise, explaining the overall upward trend in sales of plant protection products. Members of the Phyteis network point out that biocontrol products will account for almost 35% of their total sales by 2023.

Figure 1: Trends in consumption of active substances by type of use in France between 2009 and 2021. In yellow : Active substances not used in organic farming and not used in biocontrol products. In green : Active substances usable in biocontrol products and/or usable in organic farming. In red : Three-year average (years N-1, N, N+1) of the total quantities of active substances excluding uses in organic farming and excluding biocontrol
Since its inception, the Ecophyto strategy (or rather strategies) has not been unanimous in its ability to halve the use of plant protection products (Assemblée Nationale, 2023). The Dephy farms launched by the government as pilot farms to trigger significant reductions in the use of plant protection products are struggling to meet the very ambitious targets set.
It is perhaps worth emphasizing that doing without half of these active substances is in reality no mean feat. The technical impasses of certain itineraries (management of grasses in field crops, management of insect pests of the Coleoptera family in seeds and seedlings, as well as during grain storage, but also mildew and black rot in viticulture, management of weeds but also of Lepidoptera in horticulture and fruit and vegetables…. ), the need to secure farmers’ yields, unsupported risk-taking on the part of farmers, and the difficulty of controlling all forms of bio-aggressors must all be taken into account. In the light of these issues (and certainly of a good deal of lobbying), Europe recently legislated to extend the period of use of glyphosate by 10 years, and derogations had been granted for neonicotinoids to combat beet yellows in the 2020s.
The incessant quarrels surrounding these increases and/or decreases in product sales generally depend on :
- the reference period used by critics to compare current levels (2009-2010, 2015-2018…),
- whether or not biocontrol products and those used in organic farming are taken into account, and
- the units used to measure the use of plant protection products (IFT – Indice de fréquence de traitement, QSA – Quantité de Substance Active, NoDU – Nombre de Dose Unité, Harmonized Risk Indicator – HRI-1 and 2…).
Some players are also calling for a reworking of quantitative indicators. For example, NODUs (number of dose units) express product use in relation to a registered dose. Insofar as the dose decreases with legislative changes, the NODU indicator naturally increases if practices remain the same, all other things being equal. It should also be noted that crop protection products are not always used in the year in which they are purchased.
The mapping of IFT (Indice de Fréquence de Traitement) in France is mainly representative of the territorialization of French production, with wine production in particular (see one my other blog entry – only in French version) and large-scale vegetable production in northern France, such as beet and potatoes (Solagro, 2022). In France, 80% of phytosanitary product purchases are concentrated in the field crop and wine-growing sectors (SGPE, 2024).
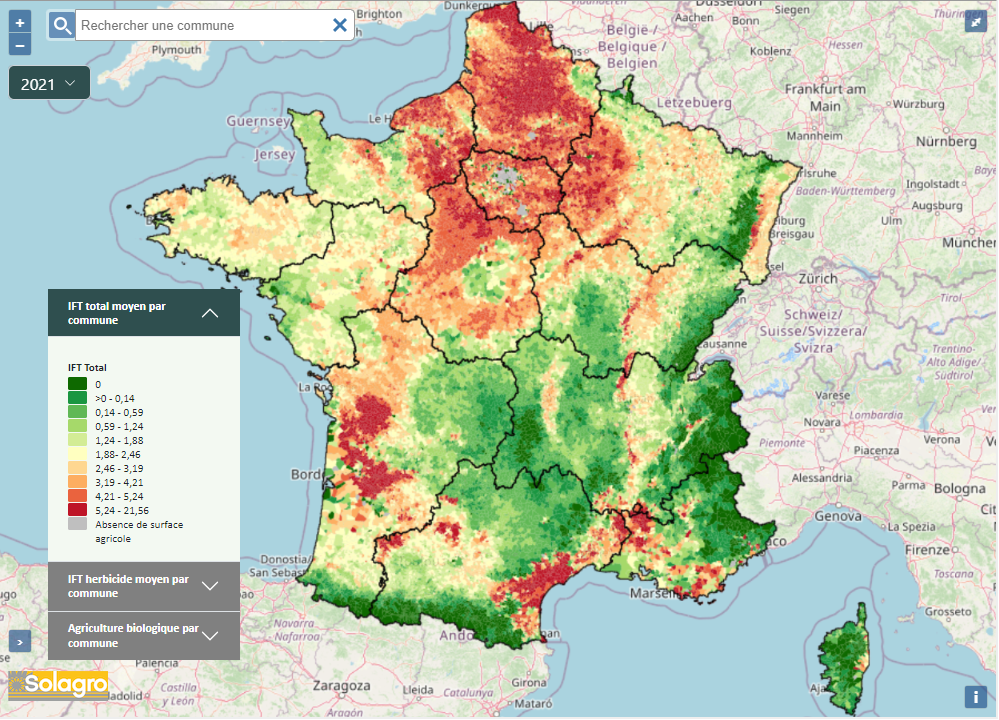
Figure 2. Average Total Treatment Frequency Indices (from low green to high red values) by commune in 2021. Source: Solagro. The IFT evaluates the number of registered doses applied per cadastral hectare. The IFT of a treatment is calculated as the ratio between the dose applied and the reference dose of the product used, multiplied by the proportion of surface area treated.
France is still dependent on the use of plant protection products. This dependence is also expressed by the fact that a large proportion of the active substances needed to formulate plant protection products are not produced in Europe, and that the manufacturing processes for these active substances are carried out in different countries (CGAAER, 2023b). Nevertheless, France would have a net export balance of over 1 billion dollars for phytosanitary products (SPGE, 2024). This dependence is also linked to the erosion of the genetic diversity of the agricultural products we produce, whose genetic base has become narrower, and to the relatively standardized farming itineraries that have been shaped by decades of technical, regulatory and socio-economic developments.
Insofar as conventional farming systems have been partly structured around the use of plant protection products (genetic selection, technical itineraries, etc.), it is not easy to compare systems with and without plant protection products, all other things being equal (The Shift Project, 2024).
All agricultural transition scenarios (Afterres, TYFA, ADEME…) assume a reduction in the quantity of plant protection products used. These products have a proven impact on the biosphere in general (biodiversity, soil, water) and on human health. Active substances can remain in the environment, and particularly in soils, for many years. Without wishing to defend conventional agriculture, it should be noted that phytosanitary products authorized for use in organic farming, even if of natural origin, can also be harmful to biodiversity (e.g. spinosad, neemazal). It will also be necessary to question the benefit-risk balance between, on the one hand, the elimination of highly effective (and potentially very harmful) active molecules requiring few treatments and visits to the fields, and, on the other hand, the use of less effective but less harmful substances (those used in organic farming or biocontrol) but requiring more regular visits and potentially resistance phenomena as well.
At the end of 2023, the French government launched the PARSADA program, a strategic action plan to anticipate the potential European withdrawal of active substances and develop alternative crop protection techniques. The primary aim is to provide farmers with technical support in the face of the risk of certain active substances being withdrawn from the market.
Following the separation of the sale and advice of plant protection products to avoid conflicts of interest, the majority of sales outlets and cooperatives have turned to the sale of products. The strategic phytosanitary advice (CSP) that farmers must receive to maintain their certiphytos and thus their ability to continue using phytosanitary products in the field is still far from being provided in full (Ministry of Agriculture and Food Sovereignty, 2023). CGAAER points out that it will not be possible to meet the timetables and targets set for agricultural players, notably due to the lack of independent advisors and the failure to effectively separate sales and advice in the field.
What digital tools are available?
Our collaborative census of digital tools in agriculture (Wiki Agri Tech) has led us to categorize the digital ecosystem into 5 major functions (see Figure 3). Without representing this discrimination in detail, you can roughly find :
- Sensors and measuring instruments [Observe and Measure].
- Databases and land management software [Organize – Manage – Trade].
- Decision-support tools incorporating simple or advanced agronomic models [Advise – Train – Support]
- Observation networks, collaborative tools and data exchange tools [Exchange – Share – Collaborate]
- Robots and actuators [Act and Apply in the field]
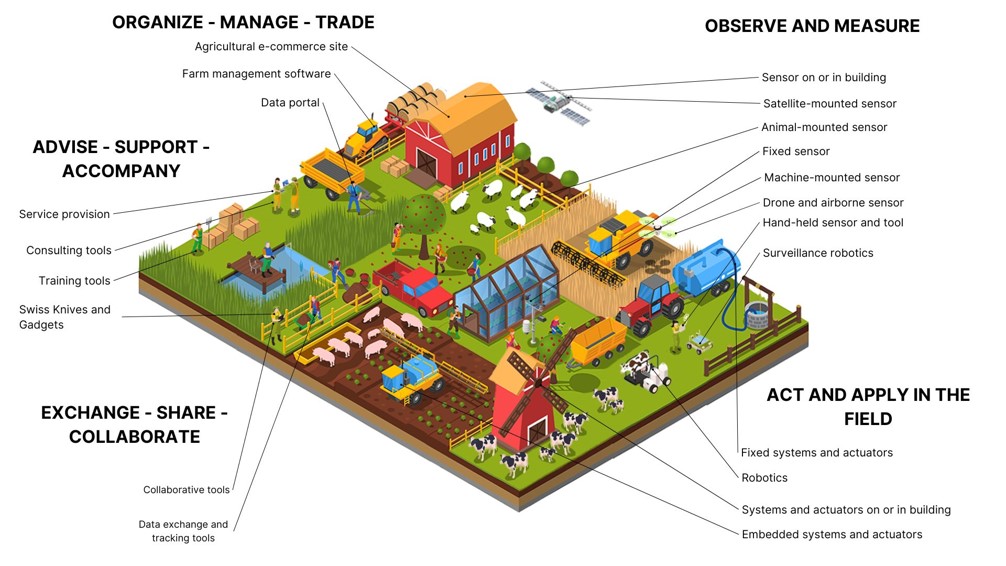
Figure 3. The five main functions of digital technologies in agriculture, right up to the farm gate. Source: Wiki Agri Tech. Read our white paper!
In the field of pest management, the objectives of digital tools are quite broad. We’ll look at them in more detail in the dedicated sections. Here are just a few examples:
- Monitor the territory (in real or delayed time) for emerging risks.
- Delaying and/or avoiding phytosanitary treatments, whether for economic or environmental reasons.
- Evaluate the risk of a disease outbreak to (re)design your crop protection strategy.
- Initialize an agronomic model parameterization or check that a model is not drifting too far, to better characterize future pest peaks
- Define control zones or sentinel plots to ensure maximum completeness of pest representation
- Save time spent touring fields for in-situ pest monitoring.
- ….
All these objectives take us back to different spatial dimensions and timeframes:
- Pest detection, which can be carried out in real time or with a time lag.
- Identification, recognition or discrimination of bio-aggressors, which can be carried out once detection has taken place, i.e. when the presence or absence of a bio-aggressor is known.
- Anticipation of the arrival of a pest, to prevent and potentially adapt to its arrival.
- Predicting the presence of a pest, enabling you to project ahead in time and assess the presence or level of infestation or severity of attack by a pest in the future.
Depending on the pest, these dimensions are not all of equal interest. Disease prediction, for example, is more relevant than disease detection, as it is often too late when diseases are visible.
Pest management must also be considered from an economic and organizational point of view for farmers. Some agricultural sectors have more interest than others in tackling the subject of crop protection, because added value or yield security is more important. These technical and economic considerations thus have an impact on the level of digital tools available to each plant sector, because the market will tend to favor those sectors with the biggest outlets (The Shift Project, 2024 – note on agricultural technologies).
Each of the following three sections is organized in a rather similar way: a mapping of the players involved and keys to understanding the application of digital technologies. The tools and/or suppliers of digital tools presented are not necessarily exhaustive. We invite you to visit our Wiki Agri Tech platform and reference tools you may not have found there.
For weed management
A quick look at the panorama of digital tools for weeds
Weeds are certainly the main entry point for digital technologies in terms of bioaggressors (Figure 4). Detection will be all the more interesting for crops with high added value (economic stakes) or crops with the highest IFT (Treatment Frequency Indices) (environmental stakes). Certain crops could be targeted for reasons of production rights, by ensuring, for example, the absence of alkaloids in harvests).
For small-scale or industrial players (e.g. agro-businesses, agro-industrialists), detection can support the organization and logistics of harvesting sites, assess the level of infestation remaining after weed control (e.g. post-glyphosate regrowth) and guide differentiated harvesting to limit infestation of harvesting equipment (could we also imagine devitalizing weed seeds before harvest?). Beyond differentiated application, detection tools can be used to support plot diagnosis, in the sense that there is always a risk in leaving weeds in the field. For example, we might ask whether it is possible to save part of a plot if weeds are spatially localized.
Plant recognition tools are quite numerous. It’s not always clear whether these tools are also capable of recognizing weeds (except in the case of dedicated tools from crop protection companies). There are also plant identification initiatives such as Flore Bonnier from the 80s and 90s, which have been brought up to date with the latest computer technology (E-phytia, DiagnoPlant…).
Clearly, operational weed detection services using remote sensing (airplane, drone, satellite, etc.) are held by only a few players in the market. For the others, these services tend to be provided by freelancers (drone companies or others). While proposing a new detection service (new weed, new plant) is relatively easy (all things considered), the large-scale industrialization of an operational service is much more complicated. Scaling up to this level currently requires the development of a network of remote pilots (with higher labor costs in France) and the installation of suitable IT infrastructures (network access for data transmission, database for image storage, image processing routines).
Flying over plots by drone and airplane also adds extra monitoring time, since weed infestation maps will subsequently have to be sent to an agri-equipment for action in the field. Nevertheless, this aerial surveillance makes it possible to prioritize weed control operations and gain in operational efficiency – we’ll come back to this later. Regular overflights over time also enable dynamic monitoring of weeds. For example, a farmer might ask himself how the spatial organization of thistle rings in his plots is evolving, in order to assess his ability to control them, or to judge whether thistle rings reappear more quickly after certain farming practices or crops.

Figure 4. Overview of digital technologies adapted to weed management in agriculture. Some weeds detected by remote sensing: Datura, Ambrosia, Morelle, Bindweed, Thistle, Rumex…
Numerous on-board sensors are deployed on agricultural equipment to enable weeds to be detected in real time and commands to be transmitted to weeding tools hitched behind the tractor, with section cutting or nozzle regulation systems. However, these detection systems remain particularly expensive (because you potentially need to add a camera every 10 meters on a spray boom). This type of action is therefore not suitable for all types of farming.
Last but not least, there are (very) many land-based robotic solutions whose marketing positioning is built around reducing the use of phytosanitary products. A wide variety of weed control methods are available (chemical, mechanical, electric, laser, etc.). In France, drone spraying is still very limited.
The challenges of camera weed detection
Weed detection is mainly done by camera (whether it is mounted on a tractor, an airplane or a drone) and one could even say that it is done almost exclusively by RGB camera (in the visible). Multi-spectral and hyperspectral measurements do not seem to be the most suitable. And it is certainly the spatial resolution of RGB images that contributes the most to the quality of detection. For flights at altitude, the precision will be all the finer as the altitude is low, de facto increasing the plot inspection rate.
Here we find two scenarios with varying levels of difficulty. On the one hand, the “Green on Brown” detection which involves detecting a weed on bare soil (in pre-emergence of the crop or on the inter-row). This is for example the case of the inter-row on hoed crops where we can generally weed everything that is not in the row. On the other hand, more difficult, is the “Green on Green” detection which requires detecting a weed in a plant cover (after the crop has emerged). Since it becomes necessary to separate the weed from the crop of interest (both plants with fairly similar colors), you will understand that it is significantly more complicated.
Detection and recognition algorithms must be trained crop by crop. These algorithms seem to work even better on root crops, with well-separated rows (the inter-row spacings must not be too narrow). From a vegetative development kinetics point of view, detection is more complicated on pre-harvest or when weed leaf tips protrude from the vegetation to be harvested than on early stages where the cash crop is barely visible. Some players manage to discriminate weeds at a stage barely larger than that of the cotyledons. The quality of weed detection will be all the more precise as the initial sowing of the cash crop is precise, which could ultimately promote even greater intertwining between the players in the agricultural chain. The observatory of agricultural digital uses, for example, reports ETAs (agricultural works companies) only wishing to weed areas that they have sown themselves (Observatory of digital uses, 2024).
The biggest obstacle remains the labeling of weed images (whether from the digital service provider’s internal resources or directly from the customer), with a need for relatively varied images in terms of acquisition conditions. Operational services can use the algorithms routinely or in semi-supervised detection, then followed by the visit of a specialist (e.g. weed scientist).
For pest management
Quick decryption of the panorama of digital tools with regard to pests
Here we find some smartphone applications to help identify pests. These tools do not seem to be in the hands of professionals yet, while the challenge of recognition in the field is important.
The vast majority of sensors here are connected traps based on image analysis for insect recognition. These traps are intended to correctly detect the beginnings of flights and the flight dynamics of pests for later decision-making. Image processing is more expensive but much more reliable in terms of counting insects. Among the other measuring instruments listed, we will find:
- tools focused on sound analysis for insect identification (no need for trapping in this case),
- traps with motion analysis by infrared sensor,
- radar-type sensors (a bit like those mentioned in a previous file on digital tools for beekeeping),
- scare sensors (in this case, we often stop at the absence/presence of animals) or even
- cameras embedded on fixed stakes for regular image capture.
Pest modeling tools exist but are fewer in number than for diseases, even though there seems to be a general upward trend in the number of decision support tools (DSTs) for monitoring pest dynamics. The connected traps mentioned above often stop at the detection stage – very few are interested in modeling the evolution of pest populations (this is the case with Trapview, for example). The proposals presented are often specific to particular crops or pests. The tools can be based on modeling associated with an observation database (as for the Beet Technical Institute Aphid and Weevil Alert tools and the BSV [Plant Health Bulletin] network). We can also find decision grids calibrated in the field by experimentation.
The existing robots are more likely to be drones and offer trichogramma spreading services or other biocontrol solutions. Some land robots exist, perhaps more at the research stage, in the form of vacuum robots (Bug Vacuum type) or shakers (Colobee for Colorado potato beetles).

Figure 5. Overview of digital technologies adapted to the management of insects and pests in agriculture.
The challenges of monitoring pests with digital tools
Pyralids, Cesamia, Noctuids, Green Aphids; Butterflies and aphids appear to be the most monitored insects. The main current requests revolve around corn and relatively little for wheat, perhaps because the impact of a pest does not justify the cost of treatment. The green aphid, carrier of beet yellows, is harmful unlike the black aphid, which is simply a sucking and biting insect (but automatic detection by connected trap does not allow us to go down to the aphid stage). In arboriculture and vineyards, butterflies are also mainly sought: leafrollers (eudemys, cochylis, etc.), leafhoppers (flavescence dorée, green leafhopper), codling moths.
Each trap and each insect are different. All pests have different probabilities of falling into the traps depending on local climatic contexts (light, humidity, wind, etc.). And it remains very difficult to count the number of insects present on a hectare. Insect counts do not necessarily correlate with real pressure in the field. Insects do not fall randomly into traps. For example, they can fly more when conditions are hot and dry. Aphids, for example, are more attracted to beet leaves than to the yellow plates of the traps. Many pheromone traps only capture male insects. The sex ratio of insects is not always stable.
We could say that the intensity of the sensors shows the metabolic evolution of insects rather than their actual presence. We just know that the insect is there but not always in what quantity. Generalizing trapping is therefore not really possible and requires spending time (configuring new models, adapting existing models) to detect new pests.
It is clear that the majority of tools are interested in observation rather than prediction, and even these observations are lacking. Modeling will be difficult to achieve without a correct level of information, a good mesh (with a good location, near the areas where contamination outbreaks are most likely to start) and an ability to react quickly in the event of detection or prediction of the arrival of insect flights. The challenge remains to know how to correctly estimate the density of pests in the fields without doing too much sampling. Shared alert systems, with collaborative trapping networks could make sense. In addition to the financial interest for producers who would share these trapping networks, these networks also make it possible to better monitor, for example, the dynamics of migratory insects. Modeling, when it is carried out, is often based on related climate data. Auxiliary landscape data (areas of rapeseed and/or nearby forest, area and rate of grass cover, biomass indices of nearby crops, etc.) could also help explain the observed dynamics.
It seems that we are able to make predictions about very few pests and insects compared to what is out there, perhaps in part because seed treatments and other protective actions have limited the need to ask too many questions about insects in general.
For disease management
Quick decryption of the panorama of digital tools with regard to diseases
The tools and services for monitoring or supporting disease recognition by smartphone in the field are relatively underdeveloped.
There also do not seem to be any large-scale operational services for disease detection. Here we find some specific tools that have been proposed (e.g. Force-A’s fluorescence tools for vines, which have since stopped, or spore sensors from companies such as Biology as a solution). Spore sensors seek to measure mildew inoculum in the air to subsequently model an infectious potential and monitor the first germinations to best position cultivation interventions. Other companies instead offer tailor-made mapping services for specific disease detection, although it is relatively difficult to know the detection capacity of these tools.
The majority of the services/tools offered are geared towards providing disease forecasts (stages of development, risks, etc.) obtained from models often developed by Arvalis (Prévi-LIS [for risk forecasting], Stadi-LIS [for forecasting disease development stages]). Competition between companies is then based more on the ergonomics of the tool and the user experience – the calculation engines are left to Arvalis. The results of these models are not spatialized at a scale finer than the plot. They are “simply” average plot forecasts, developed mainly from meteorological data. This weather data can be local (weather stations) or come from more general suppliers. Arvalis tools (traditionally used) can be used as is or by adding a layer of interpretations based on observation or on poorly understood diseases.
Here are some examples that can be expected at the output of models:
- favorable or unfavorable days for the development of the disease,
- disease dynamics (e.g.: how spores splash, etc.) to predict non-visible disease (contaminated leaves) and emergence of symptoms,
- a treatment schedule at the output,
- a threshold crossing date (first time the disease crosses a threshold in the year),
- a maximum of diseases at the end of the campaign
- a week-to-week prediction (e.g.: from the weather of the last 3 weeks, we try to predict what will happen the following week)
We also do not find many robotic tools specialized in diseases. Some robots offer crop protection by UV. The regular passage of agricultural equipment or robots could be a source of agro-environmental data acquisition even if the use of such data is not yet very clear. Rather than robotic tools, these are rather section cutting systems or on/off actuators (or even capable of modulation for example for different phenologies or foliage development) that are present on the market. The Diimotion Smart Mac system, for example, makes it possible to cut off the viticultural spraying when no plants are detected. This detection can be done by imaging, Lidar, or more simply by GNSS positioning.

Figure 6. Overview of digital technologies adapted to disease management in agriculture.
The challenges of monitoring diseases with digital tools
The interviewees mention many diseases that are rather well modeled: several on large crops, septoria and diseases of the vine and arboriculture.
Detection by sensor is not easy. Via the use of cameras, the level of precision of the images is more complicated to set up on diseases (than on weeds for example). To capture early biotic stress, it is necessary to be positioned at the right time and in good acquisition conditions. Detection works better by RGB camera than by multispectral or hyperspectral sensor (as for other bioaggressors elsewhere), without being certain however of being able to detect early symptoms. The human inspection of fields will visibly remain in place for a long time, even if one could imagine passages of motorized vehicles or drones to do inspections at regular intervals.
With regard to diseases, the sensors would have to be better than the models. However, once the models work and have been parameterized on a few agronomic variables (varieties, soil type, density), these models are scalable and relatively economical. Considering in parallel the dynamics of adoption of connected weather stations, we can imagine that agro-climatic models on plant diseases continue to progress.
A whole series of models has been developed from the 70s to the 90s, subsequently taken up by the plant health bulletin and technical institutes. Some models have hardly evolved since the 80s and it could be legitimate to question their operating capacity. We can indeed discuss changes in agricultural practices and the evolution of climate data since the 80s. Digging into these “old” models involves going back to data sources or models that are not necessarily well documented, with losses of code (only executables are available) or data. Some skills may also be lacking following retirements. These models, often mechanistic, sometimes hide important statistical relationships.
Let’s try to take a step back.
Control or measure bioaggressors
Does the detection or even identification of bioaggressors make sense if it is not possible to use this information in a decision-making or subsequent cultural intervention? The capacities for detecting weeds (“green on brown”, and “green on green”) are advancing and some actors are able to go as far as discriminating between large families of weeds: dicotyledons, grasses or even perennials. To the extent that anti-grass and anti-dicotyledon products exist and are different, the distinction between these large families of weeds makes sense to avoid or limit phytosanitary treatments.
We could try to push this discrimination to the species of weed, that is to say within the family, in the sense that not all grasses are necessarily harmful to the cash crop. It is still necessary to have the products available (we do not always have usable monospectrum products) to do it and the additional passage (or not) requested must be acceptable from a technical and economic point of view. The level of weed detection must also be linked to the work flow rate of the weeding action. If real-time recognition requires a significant reduction in tractor speed, it is understandable that the logistical challenges of weeding call into question the interest of weed detection. However, we may wonder whether this reasoning really holds up.
An intermediate phase for weed management could revolve around a dual-dose application in order to separate the treatment on small and large weeds. When a phytosanitary program is established, the maximum dose is generally based on the largest weed, but the majority of weeds generally do not need to receive this full dose. It could therefore be relevant to use a background dose equivalent to half the dose and, when a large weed is detected, to push the full dose specifically.
For diseases, the detection result is generally too late (in septoria on wheat, we can have time to see the disease rise; in downy mildew, this is not possible). It must be understood that post-detection curative actions have little effect. The measurement here does not provide any interest for operational management. On the other hand, digital tools make it possible to potentially access data at a more regular time step and thus be more reactive (for example a few days before receiving a plant health bulletin). For unwanted diseases, one can wonder if there is real added value in setting up a sensor that measures that the disease is not present. If a disease model explains a high risk of presence, is there any point in having an additional measurement sensor, especially knowing that a risk can be present without being visible? In the context of diseases, the use of sentinel plots that are more sensitive to the risk of diseases can be an interesting indicator to have time to act in a limited time frame.
For pests, detection is often possible (see the section on connected traps) but the treatment must be triggered at the right time and in the rise in the number of pests, neither too early nor too late. Treatment strategies are generally not really differentiated by type of pest and we generally reason in terms of the presence or absence of insects. However, the risk relative to a pest is not simply linked to the presence or abundance but also to the state of the crop. Terres Inovia, for example, highlights the concept of “robust rapeseed” in the sense that the treatment is not at the same threshold depending on the sensitivity of the rapeseed and the density of insects.
Take a minute to move away from digital tools
The fact remains that the gaps between the doses of plant protection products actually applied and the doses set or recommended can vary significantly (see Figure 7). Monitoring the dose of products throughout its application demonstrates the fact that many practices can be put in place before thinking about digital tools: sprayer adjustment, control of product preparations to be spread, environmental conditions during application, etc.
Figure 7. Clarification of the concepts of target dose, sprayed dose, applied dose, and effective dose, and optimal dose. Source: Aspexit, 2020.
For each of these doses, specific actions can be implemented, some of which more or less take advantage of a prism around digital technology and/or agricultural equipment, as shown in previous infographics produced as part of a blog file on the links between viticultural agricultural equipment and Ecophyto programs (Figure 8).
Figure 8. Presentation and categorization of existing solutions to achieve the objectives of the Ecophyto plan. This diagram shows that many solutions already exist and are mostly operational. Source: Aspexit, 2020.
These actions are of different levels, from simple and inexpensive improvements to others requiring significant investments and/or changes in thinking.
When compared to the current state of the art of spraying in the field, some very efficient digital technologies and/or agricultural equipment may give the impression that their use would bring quite spectacular gains in plant protection products. Without calling into question the ability of these tools to actually reduce doses, I would dare to point out here that thinking about the system with all other things being equal masks the fact that many relatively simple actions to implement could bridge the gap between the current situation (sometimes very largely improvable) and a very technological situation. In addition to the myriad of non-technical levers available (which are not the subject of this article), numerous testimonies from specialists in vineyard spraying show that the basics of spraying are often not mastered by agricultural professionals (Aspexit, 2020).
Towards an evolution in the precision of phytosanitary products
Generally speaking, it is very rare for the tool (whether a sensor or a model) to suggest an action to be taken. For example, regarding pests, the tools suggest setting alerts in the event of population peaks or thresholds being exceeded. The tools do not explain whether or not to treat, and do not necessarily have information on the modes of action available (biocontrol or not). Without completely disclaiming responsibility, tool suppliers invoke the fact that it is necessary to have detailed knowledge of the application products and the insect’s development cycles (the skills of an entomologist) to reach this stage.
The BSV (Plant Health Bulletin) was initially prohibited from making recommendations. The BSV editors have a cautious attitude and give a general risk. This can nevertheless lead to confusion because the raw outputs of agro-climatic models are not always very understandable. It is possible to imagine rules that depend on the level of risk that the farmer is willing to take (depending on the actors and sectors, the philosophies may be different). For plant protection products, this non-recommendation may go against the objectives of reducing plant protection products because farmers will tend to want to treat if they see increases in the output parameters of the models.
The increase in the sale of biocontrol products (see introduction) is good news. Despite everything, these products are often less effective than conventional synthetic products and therefore call for even greater precautions in application. These products must be used for prevention (and therefore with very good upstream detection and identification capabilities) and with the greatest finesse (with well-adjusted agricultural equipment).
For weed management, several stakeholders fear that genetic and biocontrol levers will not be sufficient and have high expectations for digital tools to support weed destruction if conventional products are to disappear. In the context of organic farming (even if the sector is experiencing significant difficulties at the time of writing this report), technical levers may be complicated to implement. For example, the covering power of varieties on weeds works less well in organic farming because there is less nitrogen in these agrosystems, perhaps requiring even more relevant tools to support weeding. On the other hand, in conventional farming, mechanical weeding on cash crops with ryegrass and foxtail that are very competitive on nitrogenous environments does not make the task any easier either.
Since tools such as the Plant Health Bulletin (BSV) are free, field workers are wary of subscribing to paid models that could provide them with information on the dynamics of local diseases or pests. It remains difficult to charge for a service for which a free alternative exists, or even to charge for a service that was initially free.
Whatever the product used (traditional product, biosolutions, etc.), it seems legitimate to ask for a justification for treatment (basically, why did you treat it) since living things are extremely complex (we are not immune to resistance phenomena, for example). Obligations of means, obligations of results with intermediate results, or obligations of results under constraints can be put in place.
The organization of agricultural and industrial stakeholders around the management of bioaggressors
As we mentioned at the beginning of this blog entry, crop protection is so different depending on the pests that the skills required to work on these subjects are extremely broad. In view of the digital tools dedicated to pest management, we realize that the technological building blocks used also require specific skills and thus lead to buyouts of companies in the sector or to more or less marked coalitions.
As examples, a triptych was formed between Bosch, Amazone and BASF to provide respectively the cameras, the agricultural equipment, and the agro-climatic models to operate the lever of localized spraying. The company Bilberry, specialized in metrology and image analysis, was bought by Trimble, also bought in cascade by the equipment manufacturer Agco to centralize these skills. The John Deere company, a full-liner agricultural equipment manufacturer, offers the “Sea and Spray” technical solution and is thus one of the only companies to develop sprayers and an integrated weed management solution.
The Exxact Robotics structure, a subsidiary of the Excel Industries group, integrates its “3S” sensor into the group’s agricultural machines. Staying in the same company greatly limits the confidentiality barrier and goes further in the integration of tools than with a retrofit (i.e. a sort of second-fitting of a tool on an existing machine). In the event of a retrofit not working or a problem with spraying efficiency, the issue of liability or the person at fault becomes the heart of the problem. Is it a problem of dosage? detection? incorrect application? The conclusion can be so multifactorial that it becomes difficult to clearly name a person responsible.
Phytosanitary companies are also getting involved in this on their own. Bayer is increasing its service offering with the “MagicSprayer” spraying robot. Corteva has partnered with Sniper Technologies to ensure effective weeding of thistles on beetroot. Here, the phytosanitary company is selling a weeding efficiency service combined with localized weeding.
France Pulvé, a federation of several equipment brands offering spraying tools, is deploying partnership actions with Agritech companies (for example Sniper Technologies mentioned above but also, in another register, the FieldView plot management tool from The Climate Corporation).
Nothing will prevent distributors tomorrow (cooperatives for example) from maintaining close relationships with drone companies in the form of off-the-shelf offers to reduce herbicide doses. ETAs (agricultural works companies) will certainly develop their weeding offer with reduced treatment frequency index, particularly since on-board sensors can be significantly expensive and require a return on investment.
We are therefore beginning to see changes in business models for certain companies, with directions towards what could be called the functional economy. If phytosanitary products were previously considered a sales product for phytosanitary companies, the product becomes a net expense when the company sells a weeding service per hectare or a guarantee of healthy crops. The company is then moving more towards a guarantee of treatment effectiveness rather than a guarantee of yield. We could then question a potential increased lock-in of phytosanitary firms that would impose their conditions of application of products (while promoting at the same time their products whose modes of action and effectiveness they know) in a contract signed with a farmer under a guarantee of treatment effectiveness.
Also note that a new ISO standardization committee on digital technology in agriculture is underway with a strong focus on plant protection.
Digital tools could be used to extend authorizations on the market for active substances. Given the reduction in the number of active substances in recent years and the desire to achieve the objectives of the Ecophyto plan, phytosanitary companies may find in digital tools an opportunity to continue the approval of their products. For example, localized spraying following real-time detection of weeds by a camera on the spray boom makes it possible to significantly reduce the doses of phytosanitary products used. The reduced availability of chemical control solutions could be a call for technology for these phytosanitary companies to support the deployment of combinatorial offers and combinatorial phytosanitary products.
For these companies, this is therefore an additional argument in favor of not eliminating their molecules. Marketing authorizations could thus be conditional on the use of digital technologies, a sort of obligation of means, to ensure a minimum quantity of products applied. This technical entanglement raises questions about the technological lock-in and path dependency to which farmers who embark on this path would be subjected (The Shift Project, 2024). This obligation of means would also deprive agricultural stakeholders of using other technical levers that could have helped them achieve results targets.
The CGAAER (General Council for Food, Agriculture and Rural Areas) nevertheless points out that the marketing authorization at a reduced dose per hectare is possible but that to date, it is not used by marketers. The reduction of the dose per hectare can be decided by ANSES (National Agency for Food, Environmental and Occupational Health Safety) on condition that a new regulatory framework goes beyond its current risk-centered approach (CGAAER, 2023c). The possible solutions to be able to authorize reduced hectare doses permitted thanks to precision spraying therefore remain the evolution of the AMM framework or the regulatory route.
In the same logic, on the agro-industry side, we can imagine reflections of the type of secondary specifications of agri-food industries which would oblige (or strongly encourage) farmers to use digital tools to optimize their use of inputs.
Some links have been established or are beginning to be established between digital decision-making tools and CEPP (Certificates of Economy of Phytopharmaceutical Products) systems. For example, the company Trapview is CEPP certified, that is to say that it is recognized that their connected traps allow reductions in IFT. CEPP (Certificates of Economy of Phytosanitary Products) are systems whose objective was to force distributors of phytosanitary products to reduce their sales volume under penalty of financial sanctions.
Distributors must somehow compensate their sales volumes with CEPP (Certificates of Economy of Phytopharmaceutical Products) systems proving that they have implemented actions to reduce pesticide use. These CEPP systems were proposed to echo the French energy saving certificates that had proven their effectiveness in their sector. Currently, there would be no specific funding for traps, but we can imagine that these traps would be supported as part of operational programs (European projects, DEPHY farms, etc.). We could wonder whether the CEPP certification of a digital tool demonstrates or not its generalized operation regardless of the conditions (agro-medial-climatic, etc.) and in the long term.
Similarly, obtaining the French HVE (high environmental value) label in viticulture requires having set up dose reduction or group health monitoring systems. In the ministry’s framework contracts, there do not seem to be any audits on the ability of digital tools to actually reduce doses or not.
Questioning the adoption of digital tools
The adoption of digital tools is a complex process, made up of back-and-forths, and whose foundations are multifactorial: production objectives, ease of risk-taking, farm size, equipment and tools already present on the farm, etc.
The work of the Observatory of Digital Uses in Agriculture on mechanical weeding shows that the transition to organic farming, and therefore to mechanical weeding, can be an opportunity for farmers to use digital tools for the first time (for example, a hoe with a camera) to carry out their cultivation operations (Observatory of Digital Uses in Agriculture, 2024). This first integration of digital technologies is potentially a broader path to opening up to digital tools on the farm, over the years.
Among the stakeholders interviewed, some testify that connected traps would also be a way of getting farmers to enter into a broader reflection on trapping. If farmers are taking the plunge with connected traps to develop their manual trapping methods, it must therefore be understood that others are only just starting to trap (they did not do so before) because connected traps are available. The digital tool is thus seen as a support for the evolution of practices. We will also find farmers using connected traps located within sentinel plots to monitor that the sexual confusion they have set up is effective and that this confusion does not drift too much.
The case of the Miléos tool from Arvalis – a tool for predicting the risk of late blight development in potatoes – is interesting for demonstrating the interactions between digital technologies. Since the Miléos disease development models operate from meteorological data, the development of the tool is conditioned by access to quality meteorological data. The development of connected weather stations thus contributes to the joint development of Miléos. In the North of France, a stronghold of French potato production, a significant development of digital tools has been observed, focused on potatoes.
Doubts persist for quite a long time about the data from digital technologies. A connected trap, for example, is only an elaborate version of a classic trap – a trap that is also considered to work well. In the field, however, we will continue to wonder whether the connected trap will have really succeeded in capturing insects. Agricultural stakeholders nevertheless recognize that this type of tool is of interest, but adoption remains slow.
A disconnection of certain digital tools with the field
One might be surprised by the difference between the number of theoretical models around the development of diseases and pests, and those actually operational. The European platform IPM-Decisions lists many models from the literature. To be usable in the field, the models must necessarily be simplified so as not to engage in the collection of too many different input variables.
It must also be accepted that the development of agro-climatic models takes time. Between the construction of models and their deployment in the field, several years are needed because the actors want to verify that these models really work. Homogeneous data in quality, and sometimes over a relatively long time step, are necessary to correctly train the prediction models. From an economic point of view, the developers of these models must find compromises between, on the one hand, building systems dedicated to a given situation of a client in a country with a type of pest and an approved product, and on the other hand, proposing more global but slightly less effective systems.
For research centers, the search for operationalization of models is not really scientifically valued. Technical work, for example to build disease evolution curves following inoculations on leaves at a given temperature and time, does not necessarily find an echo in scientific journals. More generally, financial mechanisms are still very much oriented towards innovation and too little towards technology transfer in the field (for deployment and concrete handling on agricultural farms), further accentuating these imbalances.
Lack of agronomic skills
The interviewed stakeholders share the feeling of a general loss of skills specific to the management of bioaggressors, namely weed science, phytopathology and entomology.
Doing without treatment or at least limiting it significantly requires a much more detailed knowledge of the interactions between species in agrosystems and a solid background in the development cycles and biology of weeds, insects and diseases. For pests, for example, it is interesting to know where the insect spends the winter in the soil, its survival rate depending on the conditions during the winter, the triggers for its emergence from the soil, its reproduction rate, etc. Insects are treated systematically even though they are very far from being dangerous all the time. If we knew how to predict in advance when there could be population explosions, we would not have to treat systematically. Most pests are rarely problematic, but we limit the risk by treating all the time.
On weeds, the example given above in the file on the knowledge of families or even species of weeds in the fields is an opportunity to avoid certain treatments (a single pass of anti-grasses for example instead of a non-specific pass) by perhaps even going so far as not to treat if the weed species on site do not have a significant impact on securing yields. We then come back to the possibility of discriminating weeds by the digital tools we have talked about and access to existing control or intervention strategies.
This call for cross-skills is perhaps also what can make it possible to move from the development of so-called “tactical” digital tools (reactive mode vision, for year-round management or in crisis situations) to rather “strategic” tools (reflexive mode vision, for rather long-term management). Strategic modeling tools could work at the scale of the agricultural farm as a whole to propose and prioritize common levers and actions between the crops present on the farm. We could indeed imagine working at the scale of the rotation rather or of the complete crop rotation rather than at the level of a specific crop on a given plot. The curative vision (one solution, one problem) could give way to a preventive vision by digital simulation. To the extent that climatic, energy or regulatory conditions will lead to reducing the scope of existing solutions, working on the development of strategic tools could be used to take a step back from our complex problems.
Between uncertainties, risks and responsibilities
“Where there was a problem every five years before, it is now every two years. Chaos is the new normal.” This testimony found on social networks retraces for me quite well the growing uncertainty that farmers face in the field.
Our agrosystems are particularly fragile, and their capacity to be resilient and to adapt to profound global changes – including pests – accentuated by climate change raises questions (The Shift Project, 2024). The evolution of the distribution areas and development cycles of diseases and pests generated by rising temperatures leads to the arrival of new pests in our regions. We will also have difficulty producing in certain French territories with climate change. Some agricultural production will also have to move due to changing soil and climate conditions and it will be necessary to adapt to new agricultural practices for managing pests. Mechanical weeding, which works relatively well on draining surface soils, is much more complicated on more clayey and fragile soils such as hydromorphic loams (which represent a lot of soil in France).
The current phenomena of resistance to phytosanitary products that we are witnessing – although particularly worrying – are likely to intensify. The health impacts (increase in ergot, datura arriving in the north, ragweed on the outskirts of Paris, etc.) also call for attention to the significant human health issues that could arise. On a small positive note, climate change could, in some years, reduce certain fungal pressures linked to humidity/temperature parameters, particularly during the summer season (The Shift Project, 2024).
The warmer the climate, the more favorable the conditions are for the development of weeds and pests. They also degrade the effectiveness of products (increase in volatilization and leaching, acceleration of the degradation of substances) and promote the emergence of resistance.
However, not all actors manage risk in the same way. Risk management is perhaps even more important for manufacturers. Some companies cannot afford to have damage to crops or to have eggs or insects that will end up in the factory. Depending on the type of products worked – fresh, canned or processed products – customers will necessarily be more or less tolerant.
How can digital tools then address this issue of risk in the management of bioaggressors? Opinions differ between the interviewees. For some, farmers and advisors prefer the decision to the elements that lead to the decision. With ever more changing and highly variable soil and climate conditions, decision support models would be reassuring aggregators that would take into account the complexity of the agricultural world. For manufacturers and suppliers of digital tools, the responsibility related to these decision-making tools is still left to the farmer.
A closer look reveals that this delegation of responsibility is not always clear. In the case of sensor systems embedded in machines, particularly those that activate an application in real time on the tool attached to the tractor, for example localized weeding, it is clear that the farmer or operator no longer really has control over the choice of what is sprayed or not. At most, he will be able to see after trial and error in the field by stopping the machine regularly or a few days after treatment whether the operation was a success. He will have to trust the complete technological package, here: the agricultural equipment, the sensor and the detection model. The farmer may nevertheless retain responsibility for the dose in the sense that it is he who chooses to use the approved dose and it is the technology that decides whether or not to modulate the doses of plant protection products. For some manufacturers, responsibility can only be assumed if they have control over the agricultural equipment or technology used, for example by ensuring that these machines have been approved by them beforehand.
It remains difficult to take a broad step back from the pests and diseases on your farm – for example, assess the overall resilience of your farm or a territory to a particular pest – and how to manage it. The intention should no longer be to arrive with the right product at the right time, but rather to limit the overall risk a priori. And current decision-making tools, called “tactical” in the sense that they will support a short-term decision and act in response, are not yet sufficiently in line with global risk modeling. These tools could, for example, encourage the implementation of technical levers or at least their prioritization to reduce the risk of pest action or development. In these increasingly uncertain times, tactical tools no longer seem sufficient. Even current approaches, such as French HVE (high environmental value) label for example (we can certainly think good or bad about them…), remain controls at a time t and do not offer support or really give a general direction towards this global resilience. The scoring in place does not necessarily explain the underlying agronomic interest.
Concluding remarks
Our digital panorama is limited here to a few main bioaggressors: weeds, pests and insects, diseases. This spectrum, although limited, remains quite compartmentalized in terms of expertise as the themes are so different. The actors interviewed remain for the most part specialized in their bioaggressor. It emerges from the panorama that sensors, models and Decision support tools, and agro-equipment exist for each of these bioaggressors but to varying degrees. Weed management certainly remains the strongest orientation of digital tools for crop protection.
Regulatory changes call for limiting the chemical control means available. If this orientation is very largely desirable, it will be necessary to look at the way in which agricultural actors organize themselves to deal with it. Collaborations, partnerships, and changes in business models will be relevant if they do not engage agricultural farms in “technological lock-ins” and “path dependencies”. Certification and/or labelling issues (e.g. HVE, CEPP, etc.) must not override a necessary qualified audit of digital tools regarding the ability to actually reduce doses and this in the long term.
Future climate changes will require increasing detailed knowledge of agro-ecosystems. Farmers will have to (re)become ecologists of their plots. It is through observation, potentially aided by sensors and detection tools, and through management, potentially supported by agro-meteorological models and decision-making tools, that this knowledge can be operationalised. However, it will be necessary to ensure an effort of reality in the sense that, as discussed in the report, the detection of late symptoms can sometimes prove to be of little use if no corrective action can be envisaged.
The conventional agricultural model will be able to find ways out by moving away from tactical management of bioaggressors on farms to move towards long-term multifactorial strategic management. Skills that are still too often forgotten, such as weed science, phytopathology and entomology, will help to support this step back and work with a view to prevention rather than curation.
Additional bibliography for interviews
Anastasiou, E. et al. (2023). Precision farming technologies for crop protection: A meta-analysis. Smart Agricultural Technology, 5.
Aspexit (2020). L’agro-équipement, un levier majeur pour répondre aux objectifs d’Ecophyto dans la filière viticole française. https://www.aspexit.com/wp-content/uploads/2020/05/Leroux_2020_AgroEquipement_Viticulture_Ecophyto.pdf
Assemblée Nationale (2023). Les causes de l’incapacité de la France à atteindre les objectifs des plans successifs de maîtrise des impacts des produits phytosanitaires sur la santé humaine et environnementale. Commission d’enquête. Décembre 2023
Filho, F.H.I, et al. (2022). How does the digital transformation of agriculture affect the implementation of Integrated Pest Management ? Frontiers in Sustainable Food Systems.
Inrae (2023). Prospective : Agriculture européenne sans pesticides chimiques en 2050.
Ministère de l’agriculture et de la souveraineté alimentaire (2023a). Séparation de la vente et du conseil des produits phytopharmaceutiques. Rapport n° 22070
Ministère de l’agriculture et de la souveraineté alimentaire (2023b). La dépendance des industries agroalimentaires à l’égard des biens et services étrangers et les priorités pour s’en affranchir. Rapport n° 22046
Ministère de l’agriculture et de la souveraineté alimentaire (2023c). Réduction de l’emploi des produits phytopharmaceutiques par le développement de l’agriculture de précision. Rapport n° 23048
Observatoire des usages du numérique en agriculture (2024). Analyse de l’adoption du numérique en agriculture. Le désherbage mécanique de précision
Secrétariat général à la planification écologique (SGPE – 2024). La planification écologique dans l’agriculture. Enjeux liés aux produits phytopharmaceutiques. Juillet 2024.
The Shift Project (2024). Pour une agriculture bas carbone, résiliente et prospère. Rapport intermédiaire
Interviewees
| Structure | Prénom | Nom |
| Acta | François | Brun |
| Arterris | Edith | Caumes Sudres |
| Arvalis | Emmanuelle | Gourdain |
| Arvalis | Delphine | Bouttet |
| Basf | Jérôme | Clair |
| Bayer | Axel | Moilleron |
| Cap2020 | Cindy | Lassoureille |
| Carré | Philippe | Touchais |
| Chaire AgroTIC | Bruno | Tisseyre |
| Cirad | Quentin | Legros |
| Digifermes | Julietta | Contreras |
| Exxact Robotics | Olivier | Francart |
| Institut technique de la Betterave | François | Joudelat |
| Isagri | Esther | Florin |
| Isagri | Adelaïde | Cholet |
| La Ferme Digitale | Romain | Faroux |
| Phyteis | Julien | Durand-Reville |
| Smag | Manon | Morlet |
| Telespazio | Francis | Jumel |
| Terres Inovia | Frédéric | Salvi |
| Terres Inovia | Xavier | Pinochet |
| Trapview | Vincent | Joly |
1 thought on “Using digital technology to manage pests and diseases in agriculture”